Based on Hunterbrook Media’s reporting, Hunterbrook Capital is short $ALTM, long $SQM, and long $ALB. A member of the team submitted a whistleblower report regarding the company’s accounting to the SEC. Hunterbrook Media also shared key data with a shareholder litigation firm.
The data for water extraction metrics is sourced from Argentine and Chilean government documents, corporate reports, security filings, and third-party reports commissioned by the respective corporations.
At times, company data was originally published in different units, which Hunterbrook Media then standardized to conduct its analysis.
For water data, Hunterbrook Media considered the company’s raw extraction rates from their respective salt flats. All figures are rounded to the nearest whole number.
When annual water data was unavailable, extraction rates published as per second or per hour were converted to annual amounts, assuming a 24-hour per day, 365 days-per-year extraction schedule and capturing the maximum water consumption for Arcadium and its peers.
To calculate water intensity, Hunterbrook Media divided the amount of water the company reported using during the 12-month period by the amount of lithium produced during that same period on a Lithium Carbonate Equivalent (LCE) basis. Water in this analysis is inclusive of all groundwater, surface water, freshwater, brackish water, and non-potable water extracted from the salt flat at the site of the mine. It does not include brine extraction volumes.
Third-party water purchased by corporations was not accounted for in this data set. Some sources provided a single amount for total water consumed and did not differentiate between third party water, surface water, or groundwater sources. Finally, our calculations did not account for any reinjected or recycled brine or water.
For production data, in the many instances where the company did not originally report its production on an LCE basis, Hunterbrook Media converted the underlying production to LCE using British Geological Survey’s formulas excerpted below. For more information, visit here.

As the mining industry attempts to speak to market forces that are calling for more uniformity and clarity around supply chain inputs and vulnerabilities to climate change, publishing and presenting water and production data on this scale is a relatively novel practice. Though groups like the Initiative for Responsible Mining Assurance are working toward making disclosures more “comprehensible to stakeholders,” there remains a great deal of variation between any one project or company’s data set. As a result, our methodology here is our best effort to account for and standardize these variables.
Hunterbrook Media welcomes recommendations for improvements to our approach. If you have suggestions, email ideas@hntrbrk.com. Each data point Hunterbrook Media used in the analysis is available below.
Comparing Peers
The two primary methods to commercially extract lithium are via brine evaporation and hard rock mining techniques. Where evaporation ponds and the respective technologies and infrastructure are designed to concentrate the lithium present in the brine, hard rock miners target minerals like spodumene and process the rocks to produce lithium.
Due to the material differences in the processes and minerality between evaporation and hard rock mining techniques, Hunterbrook Media did not compare the lithium evaporation miners to the hard rock miners.
The peer group that Hunterbrook Media did select — lithium evaporation miners — have ponds that are prevalent in Latin America and China. Production and water consumption data provided by Chinese evaporation miners is sparse at best (one of the few examples of some of that data out of a Chinese facility here). For that reason, Hunterbrook Media focused on the companies operating evaporation mines in Latin America.
Lastly, the Joint Venture-run evaporation facility Caucharí-Olaroz in Argentina began producing in 2023. We excluded this one year of operational history from the peer group due to being so early in production. In evaporation mining, efficiencies are realized after the first few years of development, influencing production and water extraction rates, as Arcadium explained to Hunterbrook Media in its response.
The peer group and their facilities we selected are as follows: Albemarle and its Salar de Atacama facility, Sociedad Química y Minera de Chile and its Salar de Atacama facility, and Arcadium Lithium and its Fénix and Olaroz facilities. All of these facilities have been producing for at least eight years. ALB since 1984, Fenix since 1997, Olaroz since 2015, SQM in Chile since 1996.
We encourage any feedback or further documentation to continue to strengthen the body of data that we analyzed. To that end, here is a document (in English and in Spanish) listing the Argentine permits and technical reports that we were unable to obtain from the agencies at issue. If you have access to these documents, please send them to ideas@hntrbrk.com.
Data Sourcing Inventory
Below is a guide for each project and year Hunterbrook Media analyzed.
Note: Arcadium Lithium PLC (NYSE: $ALTM) is the merger of two predecessor companies, Livent and Allkem. The name Arcadium is used here inclusive of its predecessors (Allkem, Livent, Orocobre) and its local operators (Sales de Jujuy S.A. and Minera del Altiplano S.A.). Arcadium’s main competitors are Albemarle (NYSE: $ALB) and Sociedad Química y Minera de Chile (NYSE: $SQM).
Project: Fénix (Salar del Hombre Muerto)
Operator: Arcadium Lithium PLC ($ALTM)
Annual Water Extraction (cubic meters of water / year): 2021-2023
2021:
Livent Corp. reported its total annual water consumption across its global operations in a single figure in its annual sustainability reports. Livent’s 2021 Annual Sustainability Report included a 2021 annual water consumption volume of 3,289,463 m3 (see p.38).
Based on permitting information and company disclosures, Hunterbrook Media assumed the majority of Arcadium’s global water consumption was from Fénix. For example, in 2019, Livent reported water use information for “High Risk Water” areas, which it considered to be Argentina, China, and India. That year, the figure was 3,263,712 m3, “of which 99% was in Argentina,” according to the ESG report. That number is only approximately 150,000 m3 of water less than the average figure from 2021 to 2023.
But when Hunterbrook Media shared its data and analysis with Arcadium, the company said that Hunterbook Media was relying on global numbers as “Livent has never publicly disclosed information for individual sites.”
Since Livent has not reported site-specific water consumption data in its ESG reports, Hunterbrook Media set out to find the types of products each facility makes, the approximate manufacturing capacity, and any site-specific water consumption data that was available to estimate the company’s global water consumption on a per site basis.
Through the year 2023, Livent operations consisted of active facilities in Argentina, the US, the UK, and China. Livent sources its feedstock brine and lithium carbonate from its Fénix facility in Argentina. Livent’s lithium carbonate production represented nearly 41% of the company’s total volumes of lithium product output on an LCE basis from 2021 to 2023, according to Hunterbrook Media’s analysis of security filings.
Livent then either sells the feedstock or processes it further at its other facilities in Argentina, the US, China, or the UK. Those operations principally manufacture lithium chloride, butyllithium, lithium hydroxide, and lithium metal. Livent’s produced volumes of finished lithium products represent 59% of its 2021 to 2023 production on an LCE basis, according to Hunterbrook Media’s analysis of Livent’s security filings.
Livent’s facility in Bessemer City, North Carolina is the largest of its kind in the United States and has the capacity to manufacture a number of the finished products listed above. Livent’s facilities in China and the UK, on the other hand, are either smaller or designed more narrowly and focus on fewer finished products. Arcadium recently described its Chinese assets as “swing assets,” on its Q1 2024 earnings call.
Hunterbrook Media was unable to locate water consumption data or permitting information for the company’s operations in China, the UK, and other locations in Argentina (outside of Fénix), but did find wastewater permits from the EPA for the company’s Bessemer City location.
EPA permits for the company’s Bessemer City location reflect an approximate 4 million gallons of water discharge per year. While not a perfect data point, as it is the facility’s water discharge rate rather than its water input, it gives a sense of how much water the facility has consumed.
Assuming the water consumption in China is similar to that at Bessemer City on a capacity basis, and since Livent’s US operations have a 15,000 ton capacity of lithium hydroxide production and Livent’s China operations have another 30,000 tons, that would roughly be another 8 million gallons of water used per year.
The other product segments at different facilities are about a third the size of the lithium hydroxide assets on a capacity per ton basis. Again, assuming rough figures on a capacity basis, Hunterbook Media assumed another four million gallons of water could be used in those processes.
That would put Hunterbrook Media’s estimate of Livent’s annual water consumption as of 2023 to be 16 million gallons (or 60,563 m3 of water) per year, compared to Livent’s reported global number of more than 3 million cubic meters of water consumed per year. Based on Livent’s global data, that would represent just 2% of the global figure presented by Livent for 2023.
To account for any errors and to reflect a light that would be most favorable onto Acadium given our findings, we doubled the number in all of our figures for possible water demands from Arcadium’s operations less Fénix, estimating that water consumption data at Fénix could account for 95% or more of Arcadium’s global operational water use.
When Hunterbrook Media posed this to Arcadium, the company responded: “We can state that the majority of Livent’s historical global water use can be attributed to Fénix.”
To establish the water consumption of solely the Fénix project, we calculated 95% of Livent’s 2021 water consumption volume: 3,289,463 m3 x 0.95 = 3,124,990 m3.
2022:
For the following year, Livent’s 2022 Annual Sustainability Report reported annual water consumption volume of 3,320,211 m3 (see p.41). To establish the water consumption of solely the Fénix project, we calculated 95% of Livent’s 2022 water consumption volume: 3,320,211 m3 x 0.95 = 3,154,200 m3. See methodology and reasoning for calculations above.
2023:
Prior to reaching out to Arcadium, Hunterbrook Media modeled its 2023 numbers for water extraction rates. We used projections from Arcadium permitting information regarding what Arcadium expected its water use to be after the completion of its phase one expansion, of which phase 1A was completed by the end of 2023 and phase 1B is expected to reach completion in late-2024 to early-2025.
The projected freshwater extraction rate in 2023 for Salar del Hombre Muerto was in the range of 3,320,211 m3/yr (its 2022 annual water consumption) to 6,000,600 m3/yr (Arcadium’s modeled water consumption in its EIA after the completion of phase 1 expansion), according to local permitting information and an environmental impact assessment submitted to the governing provincial ministry.
In response, Arcadium said: “The actual number is actually not much higher than the FY 2022 figures, which is consistent with limited year-over-year production increases disclosed in our 10K.”
Based on Arcadium’s production data as it pertained to Fénix, the only year on year increases in lithium carbonate production (the product Arcadium produces at Fénix), was from 2021 to 2022 and then from 2022 to 2023.
So, Hunterbrook Media divided its 2021 production 15,400 by 3,289,463 (its 2021 water consumption) which equals 0.00468150379 and its 2022 production 16,656 by 3,320,211 (its 2022 water consumption) which equaled 0.005016661592 to understand the relationship between production increases and water consumption. Taking the two numbers and averaging them — Hunterbrook Media got a 0.004849082691 quotient.
Hunterbrook Media then solved the equation 0.004849082691 = 17,509 (Livent’s 2023 lithium carbonate production) over the unknown factor y. 17,509 times (1 divided by 0.004849082691) equals, 3,610,776.123 which is the figure Hunterbrook Media used to arrive at its modeled 2023 water consumption of 3,610,776 m3/yr. Adjusting for the fact that it is a global water figure, we took 95% of Arcadium’s 2023 modeled water consumption to establish Fénix’s 2023 water consumption: 3,610,776 m3/yr x 0.95 = 3,430,237 m3/yr.
Annual Production of LCE (ton of LCE / year): 2021-2023

Livent presented its products as seen in the screenshot above, available here. Footnote 3 explains that “actual combined production” of its lithium carbonate and lithium chloride “are lower” than what’s listed and then supplies approximate production on an LCE basis.
To get closer to a non-theoretical number to calculate the company’s water intensity, Hunterbrook Media converted the lithium chloride into LCE, and added it to the lithium carbonate figure listed in the security filings. Then, Hunterbrook Media subtracted that sum with the approximate production output Livent disclosed as the real production for that year, with an average 519 MT LCE of a difference per year (representing 2.5% of the company’s total output on a LCE basis).
Hunterbrook Media then divided the difference by two for each year and subtracted the reported annual figure for lithium chloride and lithium carbonate respectively. The final figures are presented below.
2021:
Sum of Lithium Chloride LCE and Lithium Carbonate = 18,785 MT LCE. Calculation: 18,785 MT LCE – 18,500 MT of Lithium Carbonate and Lithium Chloride production LCE = 285 MT LCE difference. 285 MT LCE divided by two rounding down is 142 MT. 15,542 MT lithium carbonate – 142 MT difference in real production and estimate = 15,400 MT of Lithium Carbonate production.
2022:
Sum of Lithium Chloride LCE and Lithium Carbonate = 21,087 MT LCE. Calculation: 21,087 MT LCE – 20,500 MT of Lithium Carbonate and Lithium Chloride production LCE = 587 MT LCE difference. 587 MT LCE divided by two rounding down is 293 MT. 16,950 MT lithium carbonate – 293 MT difference in real production and estimate = 16,656 MT of Lithium Carbonate production.
2023:
Sum of Lithium Chloride LCE and Lithium Carbonate = 22,186 MT LCE. Calculation: 22,186 MT LCE – 21,500 MT of Lithium Carbonate and Lithium Chloride production LCE = 686 MT LCE difference. 686 MT LCE divided by two is 343 MT. 17,852 MT lithium carbonate – 343 MT difference in real production and estimate = 17,509 MT of LCA of Lithium Carbonate production.
Water Intensity (cubic meters of water / metric ton of LCE): 2021-2023
2021:
Across all projects analyzed in this methodology, Hunterbrook Media’s method of calculating water intensity (m3 / ton of LCE) was to divide the annual water extraction (m3 of water) by the annual production of LCE (metric ton of LCE) for each year. In Arcadium’s response to Hunterbrook Media’s request for comment, it confirmed its method of calculating water intensity is to divide the annual water extraction by the annual production values.
Calculation: 3,124,990 m3 of water divided by 15,400 metric tons of LCE = 203 m3 of water per metric ton of LCE. Values inputted were calculated in above sections.
Livent calculated its water intensity based on global operations. Its global water consumption (m3) was divided by its global production across all operations in metric tonnage. Hunterbrook Media is not interested in the water intensity of Livent’s global operations but in the water intensity of solely the Fénix project; this difference in sourcing is the reason for the discrepancy in water intensity. Livent’s 2021 Annual Sustainability Report reported a 2021 annual water intensity of 71.39 m3 per ton LCE across all operations (see p.38).
2022:
Calculation: 3,154,200 m3 of water divided by 16,656 metric tons of LCE = 189 m3 of water per metric ton of LCE. Methodology and values inputted were established in above sections.
See explanation under Fénix 2021 water intensity for the difference in Hunterbrook Media and Livent’s water intensity calculations. Livent’s 2022 Annual Sustainability Report reported a 2022 annual water intensity of 69.46 m3 / ton LCE across all operations (see p.41).
2023:
Calculation: 3,430,237 m3 of water divided by 17,509 metric tons of LCE = 196 m3 of water per metric ton of LCE. Methodology and values inputted were established in above sections.
As of June 12, 2024, Arcadium has not yet published its 2023 Annual Sustainability Report.
Project: Salar de Olaroz
Operator(s): Arcadium Lithium PLC (ALTM) (66.5%), Toyota Tsusho Corporation (8015) (25%), and Jujuy Energia y Mineria Sociedad del Estado (JEMSE) (8.5%)
Olaroz Expansion All data values in relation to Arcadium Lithium PLC’s Salar de Olaroz site involve calculations that ensure it solely reflects the 66.5% ownership of Arcadium Lithium PLC.
In Hunterbrook Media’s water consumption data analysis for the facility at Olaroz, we include all the water used at Olaroz, including that which is associated with what the company describes as a part of its stage 1 and stage 2 production wave and expansion.
Since Fénix and the other operations did not disaggregate water consumption from new production (e.g., from an expansion) versus legacy production, Hunterbrook Media included the total amounts of water used at Olaroz, consistent with the other facilities.
For example, during the 2021-2023 timeframe of this analysis, SQM’s Salar de Atacama site underwent expansion activities, such as lithium well improvements and increasing the capacity of site facilities, and it did not separate its water usage by new versus legacy production. SQM continued to report the total volume of water extracted from its operating water wells for all its activities at its Salar de Atacama site. Its expansion efforts continue towards a goal production rate of over 200,000 tons of LCE per year.
Annual Water Extraction (cubic meters of water / year): 2021-2023
2021:
In 2022 and 2023, Allkem published an annual sustainability report with annual water extraction data provided in a supplemental data excel spreadsheet. Within Allkem’s FY23 Sustainability Performance Data spreadsheet and under the ‘Environment’ tab is the Total Water Extraction (row 245) for the Olaroz Lithium Facility for the years 2018-2023.
It is acknowledged that the Total Water Extraction includes, per footnote 1, “[i]ndustrial water, which is extracted and treated to be used in operations (Stage 1), Stage 2 and Expansion activities.” Hunterbrook Media elected to utilize the Total Water Extraction rather than the Total Operational Water Consumption (row 246) as all these activities contribute toward the mine’s water footprint, regardless of its production status. Further, Stage 1 is operational and Olaroz Stage 2 achieved its first wet lithium carbonate production in July 2023.
The 2021 Olaroz lithium facility’s total water extraction value was 627.68 megaliters. Convert megaliters to cubic meters: 627.68 megaliters = 627,680 m3.
Sales de Jujuy S.A., the local operator of the Salar de Olaroz project, is a 66.5% indirectly owned subsidiary of Arcadium (see p.97). To calculate the water consumption attributed to Arcadium’s ownership, the total water extraction value was multiplied by 66.5%: 627,680 m3 x 0.665 = 417,407 m3.
2022:
Allkem’s FY23 Sustainability Performance Data spreadsheet reported a 2022 Olaroz lithium facility total water extraction value of 1,038.11 megaliters. Convert megaliters to cubic meters: 1,038.11 megaliters = 1,038,110 m3. See the 2021 Olaroz water extraction explanation above for further details.
To calculate the water consumption attributed to Arcadium’s ownership, the total water extraction value was multiplied by 66.5%: 1,038,110 m3 x 0.665 = 690,343 m3.
2023:
Allkem’s FY23 Sustainability Performance Data spreadsheet reported a 2023 Olaroz lithium facility total water extraction value of 1,222.29 megaliters. Convert megaliters to cubic meters: 1,038.11 megaliters = 1,222,290 m3. See the 2021 Olaroz water extraction explanation above for further details.
To calculate the water consumption attributed to Arcadium’s ownership, the total water extraction value was multiplied by 66.5%: 1,222,290 m3 x 0.665 = 812,823 m3.
Annual Production of LCE (ton of LCE / year): 2021-2023
2021:
Within Allkem’s FY23 Sustainability Performance Data spreadsheet and under the ‘Value Chain’ tab is the Lithium Carbonate Production (row 9) for the Olaroz Lithium Facility for the years 2018-2023. In Arcadium’s response to Hunterbrook Media’s request for comment, it confirmed the FY23 lithium production figure for Olaroz in the sustainability performance data spreadsheet matched the production figure Allkem utilized in its water intensity calculations.
The Olaroz lithium facility’s lithium carbonate production in 2021 was 12,611 tons.
To calculate the lithium carbonate production attributed to Arcadium’s ownership, the lithium carbonate production value was multiplied by 66.5%: 12,611 tons x 0.665 = 8,386 tons.
2022:
Allkem’s FY23 Sustainability Performance Data spreadsheet reported a 2022 Olaroz lithium facility lithium carbonate production value of 12,863 tons. See the 2021 Olaroz annual production explanation above for further details.
To calculate the lithium carbonate production attributed to Arcadium’s ownership, the lithium carbonate production value was multiplied by 66.5%: 12,863 tons x 0.665 = 8,554 tons.
2023:
Allkem’s FY23 Sustainability Performance Data spreadsheet reported a 2023 Olaroz lithium facility lithium carbonate production value of 16,703 tons. See the 2021 Olaroz annual production explanation above for further details.
To calculate the lithium carbonate production attributed to Arcadium’s ownership, the lithium carbonate production value was multiplied by 66.5%: 16,703 tons x 0.665 = 11,107 tons.
Water Intensity (cubic meters of water / metric ton of LCE): 2021-2023
2021:
Calculation: 417,407 m3 of water divided by 8,386 metric tons of LCE = 50 m3 of water / metric ton of LCE. Methodology established in the Fénix 2021 water intensity section and values inputted were established in Olaroz 2021 sections above.
Allkem did not account for its total water extraction in its water intensity analysis, as it solely included water utilized directly towards production and did not account for water utilized in expansion efforts. See above for further explanation. As such, Allkem calculated a lower water intensity than Hunterbrook Media’s findings. Allkem’s 2023 Sustainability Report reported a 2021 annual water intensity of 48.8 m3 / ton LCE (see p.63).
2022:
Calculation: 690,343 m3 of water divided by 8,554 metric ton of LCE = 81 m3 of water / metric ton of LCE. Methodology established in the Fénix 2021 water intensity section and values inputted were established in Olaroz 2022 sections above.
See explanation under Olaroz 2021 water intensity for the difference in Hunterbrook Media and Allkem’s water intensity calculations. Allkem’s 2023 Sustainability Report reported a 2022 annual water intensity of 49.9 m3 / ton LCE (see p.63).
2023:
Calculation: 812,823 m3 of water divided by 11,107 metric ton of LCE = 73 m3 of water / metric ton of LCE. Methodology established in the Fénix 2021 water intensity section and values inputted were established in Olaroz 2023 sections above.
See explanation under Olaroz 2021 water intensity for the difference in Hunterbrook Media and Allkem’s water intensity calculations. Allkem’s 2023 Sustainability Report reported a 2023 annual water intensity of 42.9 m3 / ton LCE (see p.63).
Project: Fénix + Salar de Olaroz (Argentina Operations)
Operator: Arcadium Lithium PLC
In order to compare the total amount of water extraction and total water intensity of each corporation with an active lithium evaporation project, it is necessary to sum the water extraction and water intensity of Arcadium’s two active projects: Salar de Olaroz + Fénix.
Annual Water Extraction (cubic meters of water / year): 2021-2023
2021:
Total the 2021 annual water extraction from Fénix (3,124,990 m3) and Salar de Olaroz (417,407 m3): 3,124,990 m3 + 417,407 m3 = 3,542,397 m3.
2022:
Total the 2022 annual water extraction from Fénix (3,154,200 m3) and Salar de Olaroz (690,343 m3): 3,154,200 m3 + 690,343 m3 = 3,844,543 m3.
2023:
Total the 2023 annual water extraction from Fénix (3,430,237 m3) and Salar de Olaroz (812,823 m3): 3,430,237 m3 + 812,823 m3 = 4,243,060 m3.
Annual Production of LCE (metric ton of LCE / year): 2021-2023
2021:
Total the 2021 annual production of LCE from Fénix (15,400 metric ton LCE) and Salar de Olaroz (8,386 metric ton LCE): 15,400 metric ton LCE + 8,386 metric ton LCE = 23,786 metric ton LCE.
2022:
Total the 2022 annual production of LCE from Fénix (16,656 metric ton LCE) and Salar de Olaroz (8,554 metric ton LCE): 16,656 metric ton LCE + 8,554 metric ton LCE = 25,210 metric ton LCE.
2023:
Total the 2023 annual production of LCE from Fénix (17,509 metric ton LCE) and Salar de Olaroz (11,107 metric ton LCE): 17,509 metric ton LCE + 11,107 metric ton LCE = 28,616 metric ton LCE.
Water Intensity (cubic meters of water / metric ton of LCE): 2021-2023
2021:
Calculation: 3,542,397 m3 of water divided by 23,786 metric tons of LCE = 149 m3 of water per metric ton of LCE. Methodology established in the Fénix 2021 water intensity section and values inputted were established in Argentina Operations 2021 sections above.
2022:
Calculation: 3,844,543 m3 of water divided by 25,210 metric tons of LCE = 153 m3 of water per metric ton of LCE. Methodology established in the Fénix 2021 water intensity section and values inputted were established in Argentina Operations 2022 sections above.
2023:
Calculation: 4,243,060 m3 of water divided by 28,616 metric ton of LCE = 148 m3 of water per metric ton of LCE. Methodology established in the Fénix 2021 water intensity section and values inputted were established in Argentina Operations 2023 sections above.
Project: Salar de Atacama
Operator: Albemarle Corporation (ALB)
Annual Water Extraction (cubic meters of water / year): 2021-2023
2021:
Albemarle’s 2021 Hydrological Environment Monitoring Plan reports its total 2021 volume of pumped fresh-brackish water for its Salar de Atacama project. At this site, Albemarle only has rights to extract water from three water wells: Tilopozo, Tucúcaro, and Peine.

2021 Average Flow Rate and Volume of Pumped Fresh-Brackish Water for the three wells (Tilopozo, Tucúcaro, & Peine) Albemarle has rights to extract water from at its Salar de Atacama project site. Table from Albemarle’s 2021 Hydrological Environment Monitoring Plan at p.575.
To calculate the 2021 total water extraction, it is required to account for the three fresh-brackish water wells cited in the report: Tilopozo: 156,229 m3, Tucúcaro: 70,655 m3, & Peine: 637 m3. Total the volume of water extracted from each well: 156,229 m3 + 70,655 m3 + 637 m3 = 227,521 m3.
2022:
Albemarle’s 2022 Hydrological Environment Monitoring Plan reports its total 2022 volume of pumped fresh-brackish water for its Salar de Atacama project.

2022 Average Flow Rate and Volume of Pumped Fresh-Brackish Water for the three wells (Vertiente Tilopozo, Tucúcaro, and Peine) Albemarle has rights to extract water from at its Salar de Atacama project site. Table from Albemarle’s 2022 Hydrological Environment Monitoring Plan at p.646. Note: Months January-March of the above table are on p.645.
To calculate the 2022 total water extraction, it is required to account for the three fresh-brackish water wells cited in the report: Vertiente Tilopozo: 163,442 m3, Tucúcaro: 57,336 m3, & Peine: 1,211 m3. Total the volume of water extracted from each well: 163,442 m3 + 57,336 m3 + 1,211 m3 = 221,989 m3.
2023:
Albemarle’s 2023 Hydrological Environment Monitoring Plan reports its total 2023 volume of pumped fresh-brackish water for its Salar de Atacama project.

2023 Average Flow Rate and Volume of Pumped Fresh-Brackish Water for the three wells (Vertiente Tilopozo, Tucúcaro, and Peine) Albemarle has rights to extract water from at its Salar de Atacama project site. Table from Albemarle’s 2023 Hydrological Environment Monitoring Plan at p.294.
To calculate the 2023 total water extraction, it is required to account for the three fresh-brackish water wells cited in the report: Vertiente Tilopozo: 187,691 m3, Tucúcaro: 72,043 m3, and Peine: 1,212 m3. Total the volume of water extracted from each well: 187,691 m3 + 72,043 m3 + 1,212 m3 = 260,946 m3.
Annual Production of LCE (ton of LCE / year): 2021-2023
2021:
Albemarle’s 2023 Form 10-K reported its aggregate annual production from its Salar de Atacama extraction facility from 2021-2023. As Albemarle acknowledged, the production of certain byproducts is not material to the economics of the Salar de Atacama operation, so Hunterbrook Media did not account for these byproducts in its analysis.

Albemarle’s 2023 Aggregate Annual Production of its Mineral Extraction Facilities. Table from Albemarle’s 2023 Form 10-K at p.32.
The 2021 aggregate annual production from Albemarle’s Salar de Atacama site is 8,000 metric tons of lithium metal (Li).
The report published the annual production data in lithium metal, and thus, Hunterbrook Media converted the lithium metal to lithium carbonate equivalent using the conversion factor of 5.323 from the British Geological Survey: 8,000 metric tons of Li x 5.323 = 42,584 metric tons of LCE.
2022:
The 2022 aggregate annual production from Albemarle’s Salar de Atacama site is 10,000 metric tons of lithium metal. See Albemarle 2021 annual production section for further citation and explanation of data values.
Convert lithium metal (Li) to LCE: 10,000 metric tons of Li x 5.323 = 53,230 metric tons of LCE.
2023:
The 2023 aggregate annual production from Albemarle’s Salar de Atacama site is 10,000 metric tons of lithium metal. See Albemarle 2021 annual production section for further citation and explanation of data values.
Convert lithium metal (Li) to LCE: 10,000 metric tons of Li x 5.323 = 53,230 metric tons of LCE.
Water Intensity (cubic meters of water / metric ton of LCE): 2021-2023
2021:
Calculation: 227,521 m3 of water divided by 42,584 metric ton of LCE = 5 m3 of water per metric ton of LCE. Methodology established in the Fénix 2021 water intensity section and values inputted were established in Albemarle 2021 sections above.
2022:
Calculation: 221,989 m3 of water divided by 53,230 metric tons of LCE = 4 m3 of water per metric ton of LCE. Methodology established in the Fénix 2021 water intensity section and values inputted were established in Albemarle 2022 sections above.
2023:
Calculation: 260,946 m3 of water divided by 53,230 metric ton of LCE = 5 m3 of water per metric ton of LCE. Methodology established in the Fénix 2021 water intensity section and values inputted were established in Albemarle 2023 sections above.
Project: Salar de Atacama
Operator: Sociedad Química y Minera de Chile (SQM)
Annual Water Extraction (cubic meters of water / year): 2021-2023
2021:
SQM’s 2022 Sustainability Report reports water extraction data for the Salar de Atacama site from 2019-2022 (see p.315). Calculations did not include third-party water sources. The Salar de Atacama site only extracted groundwater from the Salar de Atacama Aquifer; it did not report the extraction of any surface water.

Excerpt of Water Extraction and Consumption table published by SQM. The table highlights water extraction data for SQM’s various operations in Chile. The Salar de Atacama site is SQM’s only Chilean operation that is an extraction facility. The table is sourced from SQM’s 2022 Sustainability Report (see p.315).
The 2021 total water extraction from the Salar de Atacama site was 3,616,743 m3.
2022:
The 2022 total water extraction from the Salar de Atacama site was 3,424,918 m3. See SQM’s 2021 water extraction section for further explanation and citation.
2023: SQM publishes the average annual extraction flow rate from its five collection points utilized by its Salar de Atacama project on its website. SQM acknowledges that due to a 2018 commitment, one of the five extraction wells is not active and, thus, had an annual flow rate of 0 L/s. The annual flow rates and names of the five extraction wells are as follows: Allana 1: 0.4 L/s, Camar 2: 0 L/s, Socaire 5: 63.5 L/s, CA-2015: 32.7 L/s, and Mullay 1: 18.6 L/s. See the bar graph below for reference.

Average Annual Extraction of Industrial Water Wells graph from SQM website. Bar graph image taken on June 12, 2024.
Total the annual extraction flow rate from the five extraction wells: 0.4 L/s + 0 L/s + 63.5 L/s + 32.7 L/s + 18.6 L/s = 115.2 L/s. Convert L/s to L/yr: 115.2 L/s = 3,632,950,000 L/yr. Assumes continuous active withdrawal for 365 days per year, for 24 hours per day. Convert liters per year to cubic meters per year: 3,632,950,000 L/yr = 3,632,950 m3/yr.
As of June 12, 2024 SQM has not yet published its 2023 annual sustainability report. SQM’s sustainability report historically has provided its annual water extraction volume by project, while the water consumption data in SQM’s 2023 Annual Report is not broken down by individual project site usage. The 2021-2022 water extraction calculations above for SQM relied on data published in the SQM’s 2022 Sustainability Report.
Annual Production of LCE (ton of LCE / year): 2021-2023
2021:
SQM published its 2021-2023 annual extraction yields for its Salar de Atacama operations in SQM’s 2023 Form 20-F (see p.69). Calculations did not account for potassium products as the analysis focused on lithium production and water intensity.
Due to the physical properties of lithium sulfate and how SQM discloses its lithium carbonate production (inclusive of processing at its Salar del Carmen facility near Antofagasta, Chile) Hunterbrook Media was not able to calculate the lithium carbonate equivalent that is produced on site in the Salar de Atacama. Hunterbrook Media was unable to locate publicly available lithium chloride production volumes at SQM’s Salar de Atacama.
When considering the Salar de Atacama’s total production output in tonnage, inclusive of its potassium chloride, potassium sulfate and potassium salts, the company’s water intensity figures at the site are even lower — averaging 3 m3 of water per metric ton.

SQM’s Annual Extraction Yields from 2021-2023 at its Salar de Atacama operations. The table is sourced from SQM’s 2023 Form 20-F (see p.69).
In 2021, SQM produced 108,400 metric tons of lithium carbonate from solutions obtained at its Salar de Atacama site.
2022:
In 2022, SQM produced 152,500 metric tons of lithium carbonate from solutions obtained at its Salar de Atacama site. See SQM 2021 annual production for further explanation and citation.
2023:
In 2023, SQM produced 165,500 metric tons of lithium carbonate from solutions obtained at its Salar de Atacama site. See SQM 2021 annual production for further explanation and citation.
Water Intensity (cubic meters of water / metric ton of LCE): 2021-2023
2021:
Calculation: 3,616,743 m3 of water divided by 108,400 metric ton of LCE = 33 m3 of water / metric ton of LCE. Methodology established in the Fénix 2021 water intensity section and values inputted were established in SQM 2021 sections above.
2022:
Calculation: 3,424,918 m3 of water divided by 152,500 metric ton of LCE = 22 m3 of water / metric ton of LCE. Methodology established in the Fénix 2021 water intensity section and values inputted were established in SQM 2022 sections above.
2023:
Calculation: 3,632,950 m3 of water divided by 165,500 metric ton of LCE = 22 m3 of water / metric ton of LCE. Methodology established in the Fénix 2021 water intensity section and values inputted were established in SQM 2023 sections above.
Conclusion
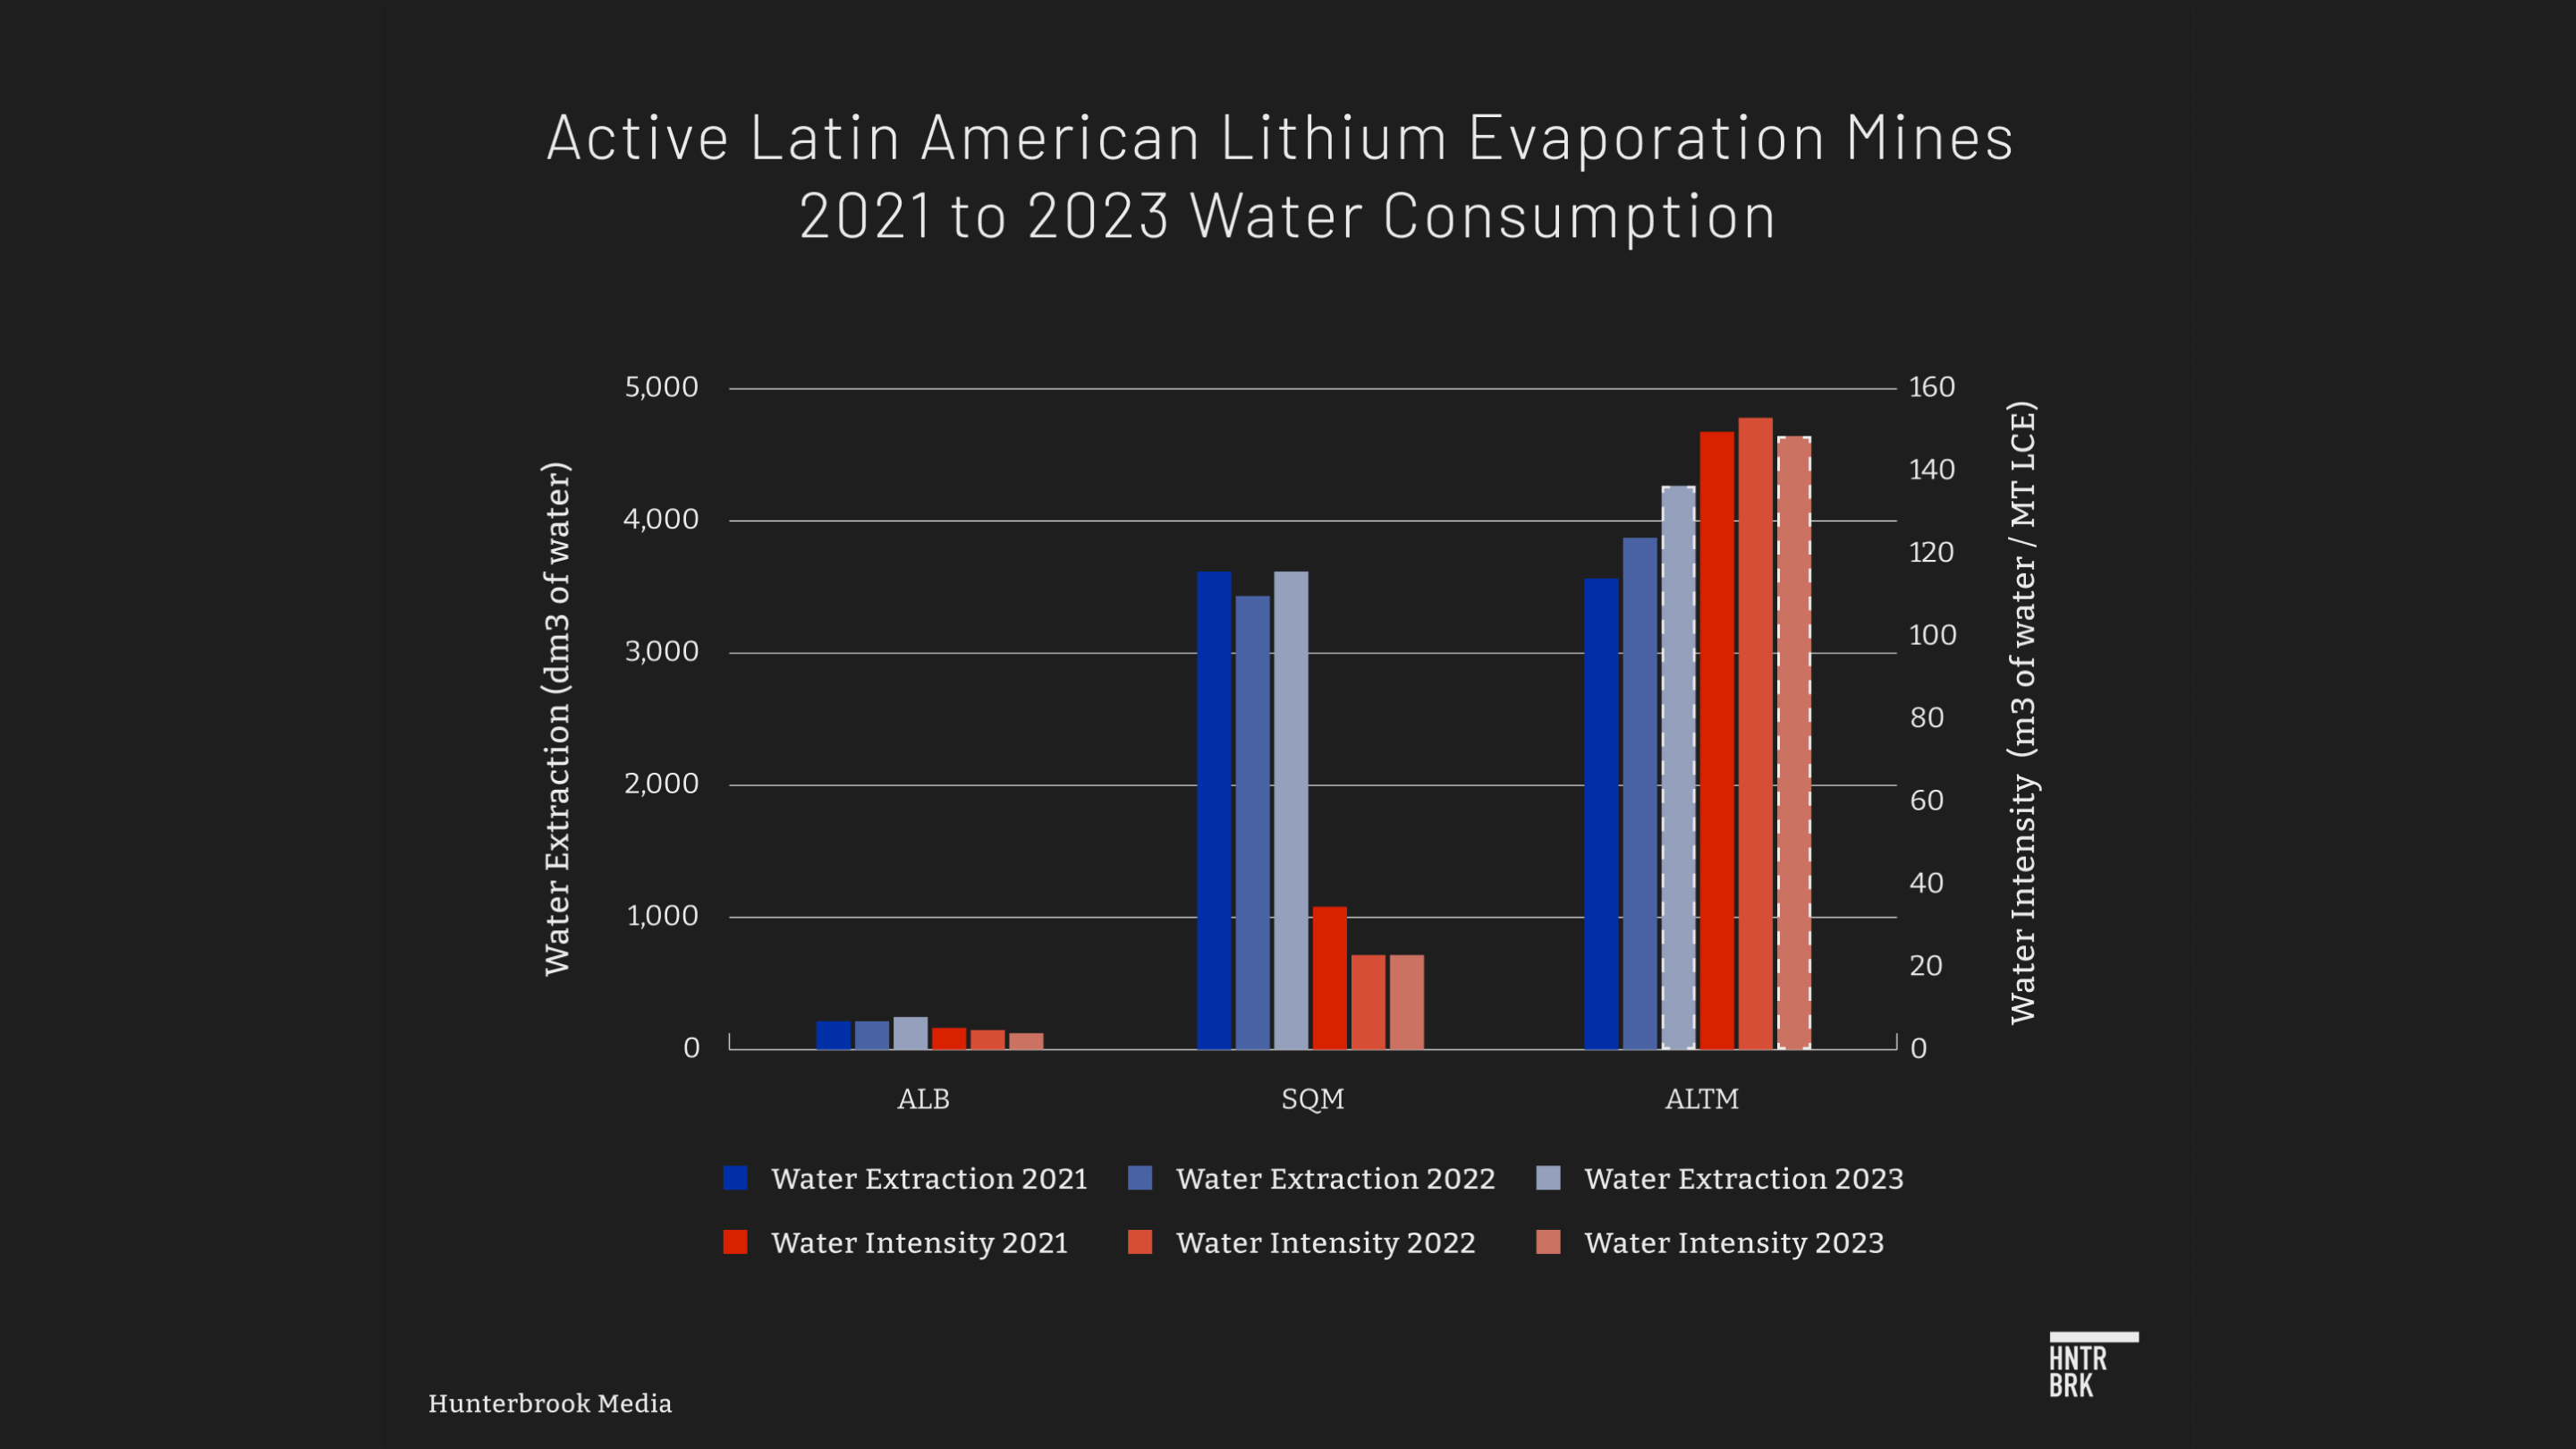
The calculations summarized in the above sections were compiled into a table to be used for graph analysis. The graph of water consumption and water intensity data is published and discussed in Hunterbrook Media’s article titled “The Company Drying Up the Argentine Andes to Power Your EV.”

Summary data table of water extraction and water intensity calculations for Arcadium’s Fénix and Salar de Olaroz facilities, Albemarle’s Salar de Atacama facility, and SQM’s Salar de Atacama’s facility.
Authors
Daniel Sherwood joined Hunterbrook from The Capitol Forum, a premium subscription financial publication, where he was an Editor & Senior Correspondent, writing and managing market-moving investigative reports and building the Upstream database. Prior to The Capitol Forum, Daniel has experience conducting undercover investigations into fossil fuel companies and other research. He also served as an Honors Law Clerk in the Criminal Enforcement Division of the EPA. He has a JD from Michigan State University. Daniel is based in Michigan.
Katie Ross is a freelance researcher and writer based in Washington. She has worked with various law firms, including Weitz & Luxenberg PC, and non-profit organizations on investigations regarding environmental, regulatory, and corporate misconduct.
Editor
Sam Koppelman is a New York Times best-selling author who has written books with former United States Attorney General Eric Holder and former United States Acting Solicitor General Neal Katyal. Sam has published in the New York Times, Washington Post, Boston Globe, Time Magazine, and other outlets — and occasionally volunteers on a fire speech for a good cause. He has a BA in Government from Harvard, where he was named a John Harvard Scholar and wrote op-eds like “Shut Down Harvard Football,” which he tells us were great for his social life. Sam is based in New York.
LEGAL DISCLAIMER
© 2026 by Hunterbrook Media LLC. When using this website, you acknowledge and accept that such usage is solely at your own discretion and risk. Hunterbrook Media LLC, along with any associated entities, shall not be held responsible for any direct or indirect damages resulting from the use of information provided in any Hunterbrook publications. It is crucial for you to conduct your own research and seek advice from qualified financial, legal, and tax professionals before making any investment decisions based on information obtained from Hunterbrook Media LLC. The content provided by Hunterbrook Media LLC does not constitute an offer to sell, nor a solicitation of an offer to purchase any securities. Furthermore, no securities shall be offered or sold in any jurisdiction where such activities would be contrary to the local securities laws.
Hunterbrook Media LLC is not a registered investment advisor in the United States or any other jurisdiction. We strive to ensure the accuracy and reliability of the information provided, drawing on sources believed to be trustworthy. Nevertheless, this information is provided "as is" without any guarantee of accuracy, timeliness, completeness, or usefulness for any particular purpose. Hunterbrook Media LLC does not guarantee the results obtained from the use of this information. All information presented are opinions based on our analyses and are subject to change without notice, and there is no commitment from Hunterbrook Media LLC to revise or update any information or opinions contained in any report or publication contained on this website. The above content, including all information and opinions presented, is intended solely for educational and information purposes only. Hunterbrook Media LLC authorizes the redistribution of these materials, in whole or in part, provided that such redistribution is for non-commercial, informational purposes only. Redistribution must include this notice and must not alter the materials. Any commercial use, alteration, or other forms of misuse of these materials are strictly prohibited without the express written approval of Hunterbrook Media LLC. Unauthorized use, alteration, or misuse of these materials may result in legal action to enforce our rights, including but not limited to seeking injunctive relief, damages, and any other remedies available under the law.