Based on Hunterbrook Media’s reporting, Hunterbrook Capital is short $UWMC and long $RKT at the time of publication. Positions may change at any time after publication. This is not investment advice. See full disclaimer below.
Hunterbrook Media spent over a thousand hours ingesting publicly available data, designing the database behind this investigation, and building out the analytics that run on top of it.
We leveraged the collective knowledge of an interdisciplinary team — including Nick Gibbons, a certified fraud examiner who was formerly head of quant forensic research at Citadel; a machine learning data scientist; and a former mortgage-backed securities trader at Morgan Stanley who is now a mortgage loan officer (yes, he shops across lenders) — to develop a methodology that, as accurately as possible, reflects the true pricing imposed on borrowers across the United States.
Hunterbrook also shared the methodology with independent academics and industry experts to confirm that the approach was sound. We actively sought ways to improve our initial approach, to accurately analyze and report the conditions in the mortgage market.
We also know that “there can always be unobserved stuff,” as Stanford Professor Greg Buchak told us. So if you see ways to improve our analysis, or shortcomings beyond the ones we lay out below, please let us know at ideas@hntrbrk.com.
The analysis is based on two datasets: Home Mortgage Disclosure Act data (the “HMDA Data”), which is filed with the federal government by major mortgage lenders and includes information about the interest rates and closing costs of loans; and deed of trust data (the “Deed of Trust Data”), which is filed at the county level in connection with individual mortgage closings and includes information about which loan officers and brokers were involved.
By merging millions of loans between the two datasets based on overlapping fields, Hunterbrook was able to answer a question we had not seen tackled anywhere else: To what extent were independent mortgage brokers shopping for the best deal for borrowers, as advertised?
It’s a question with two parts:
1) To what extent are brokers shopping?
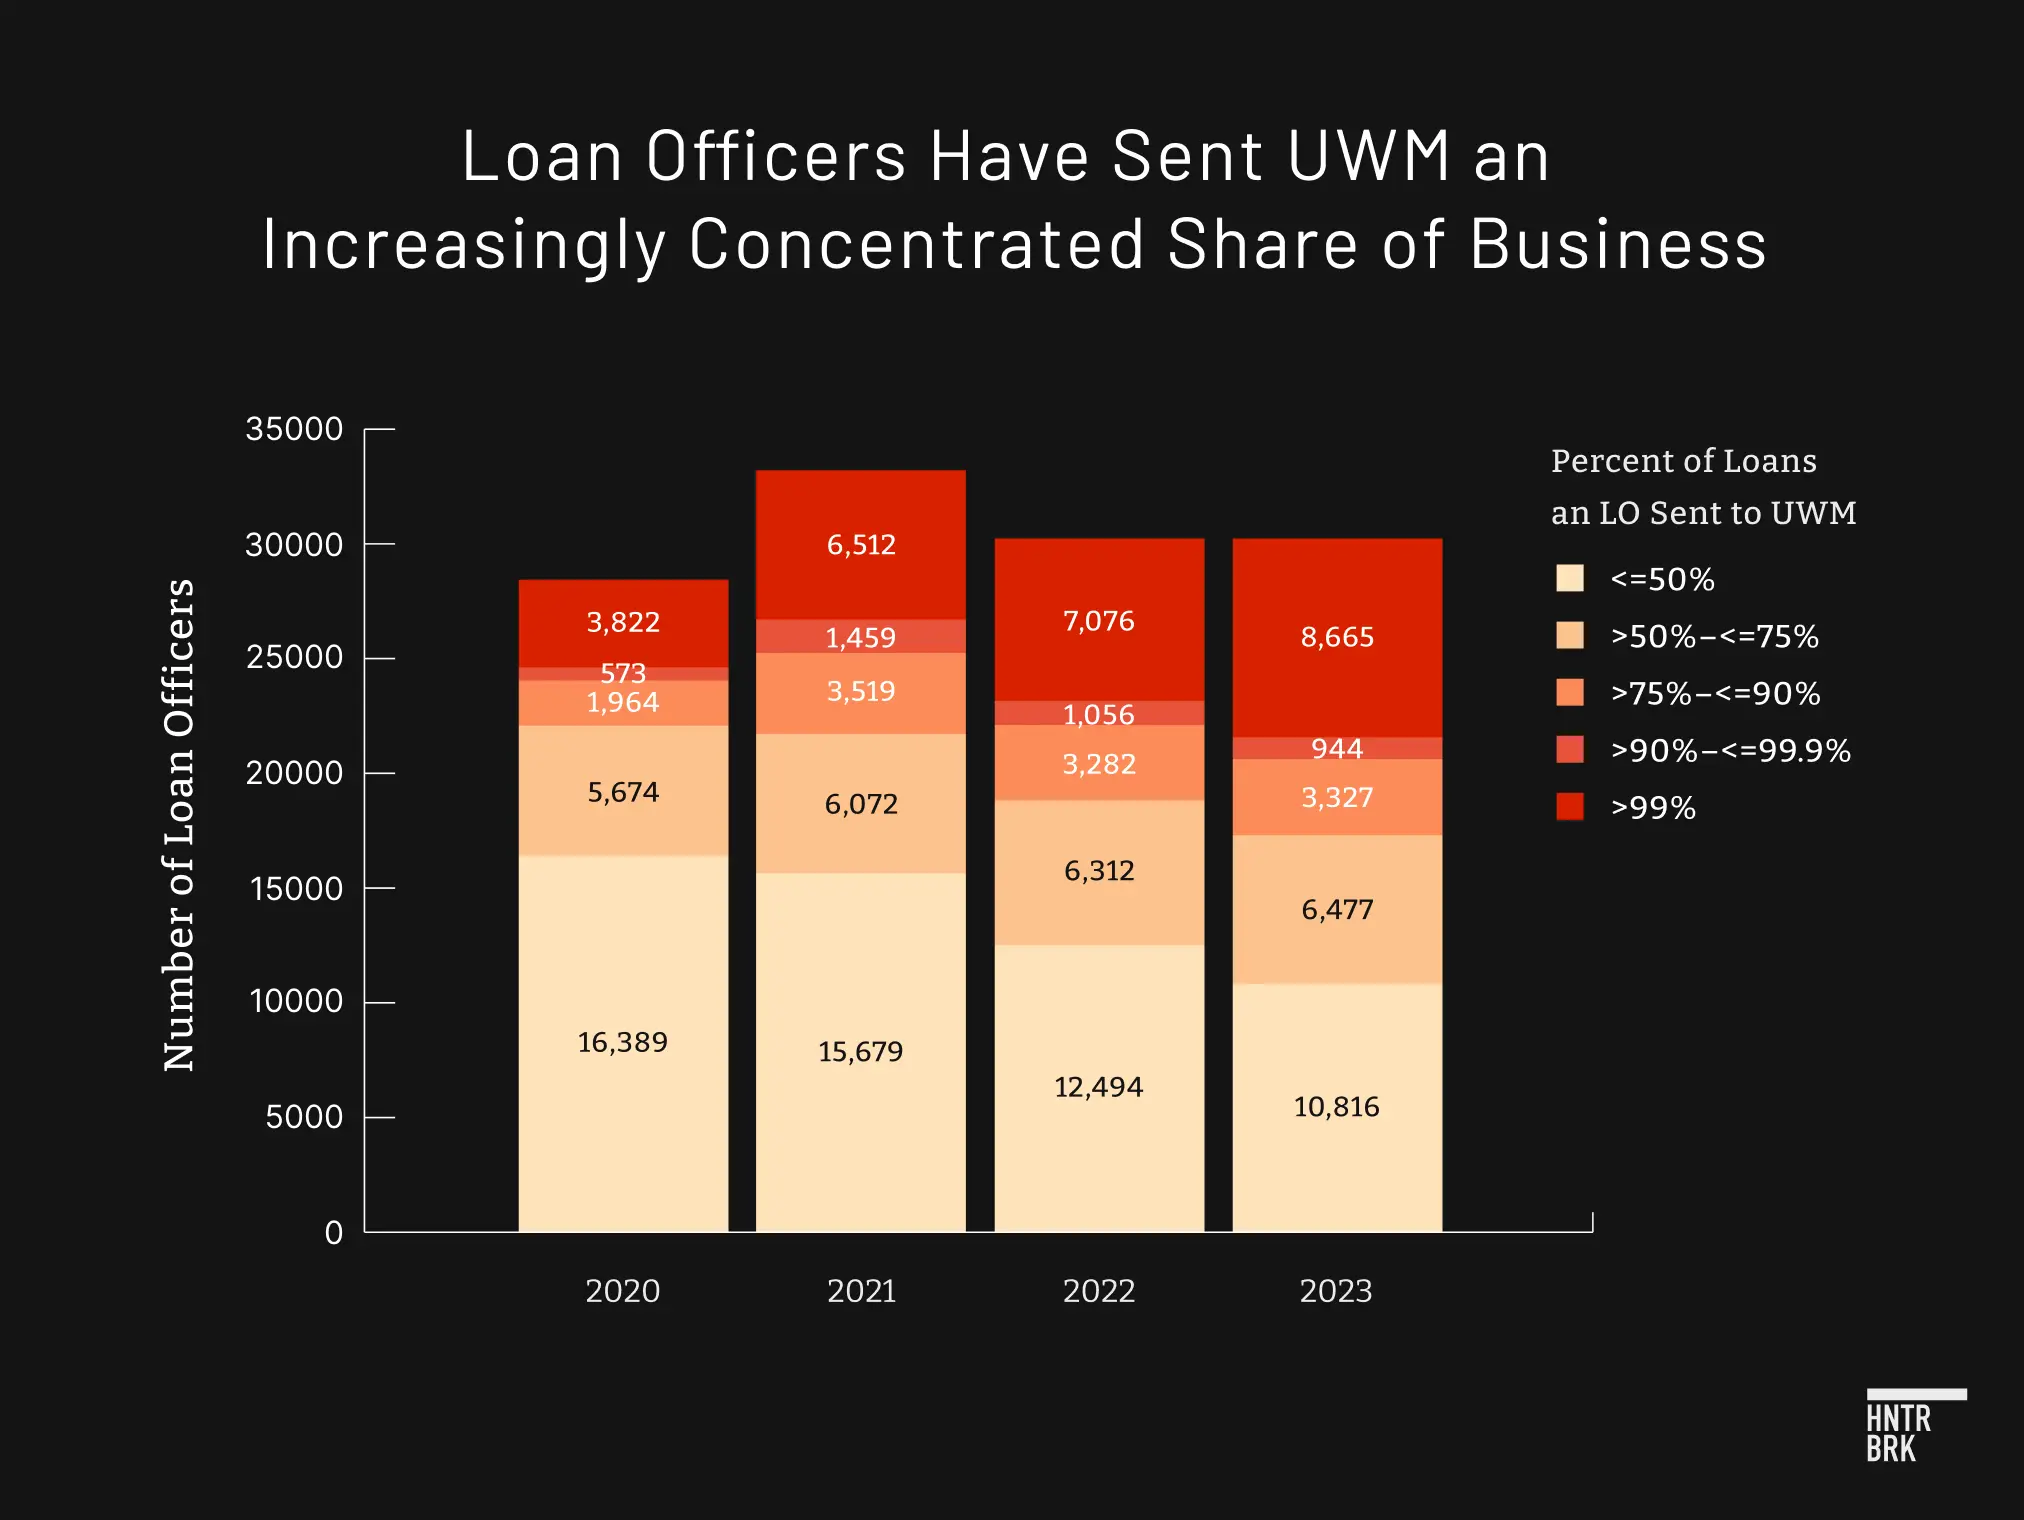
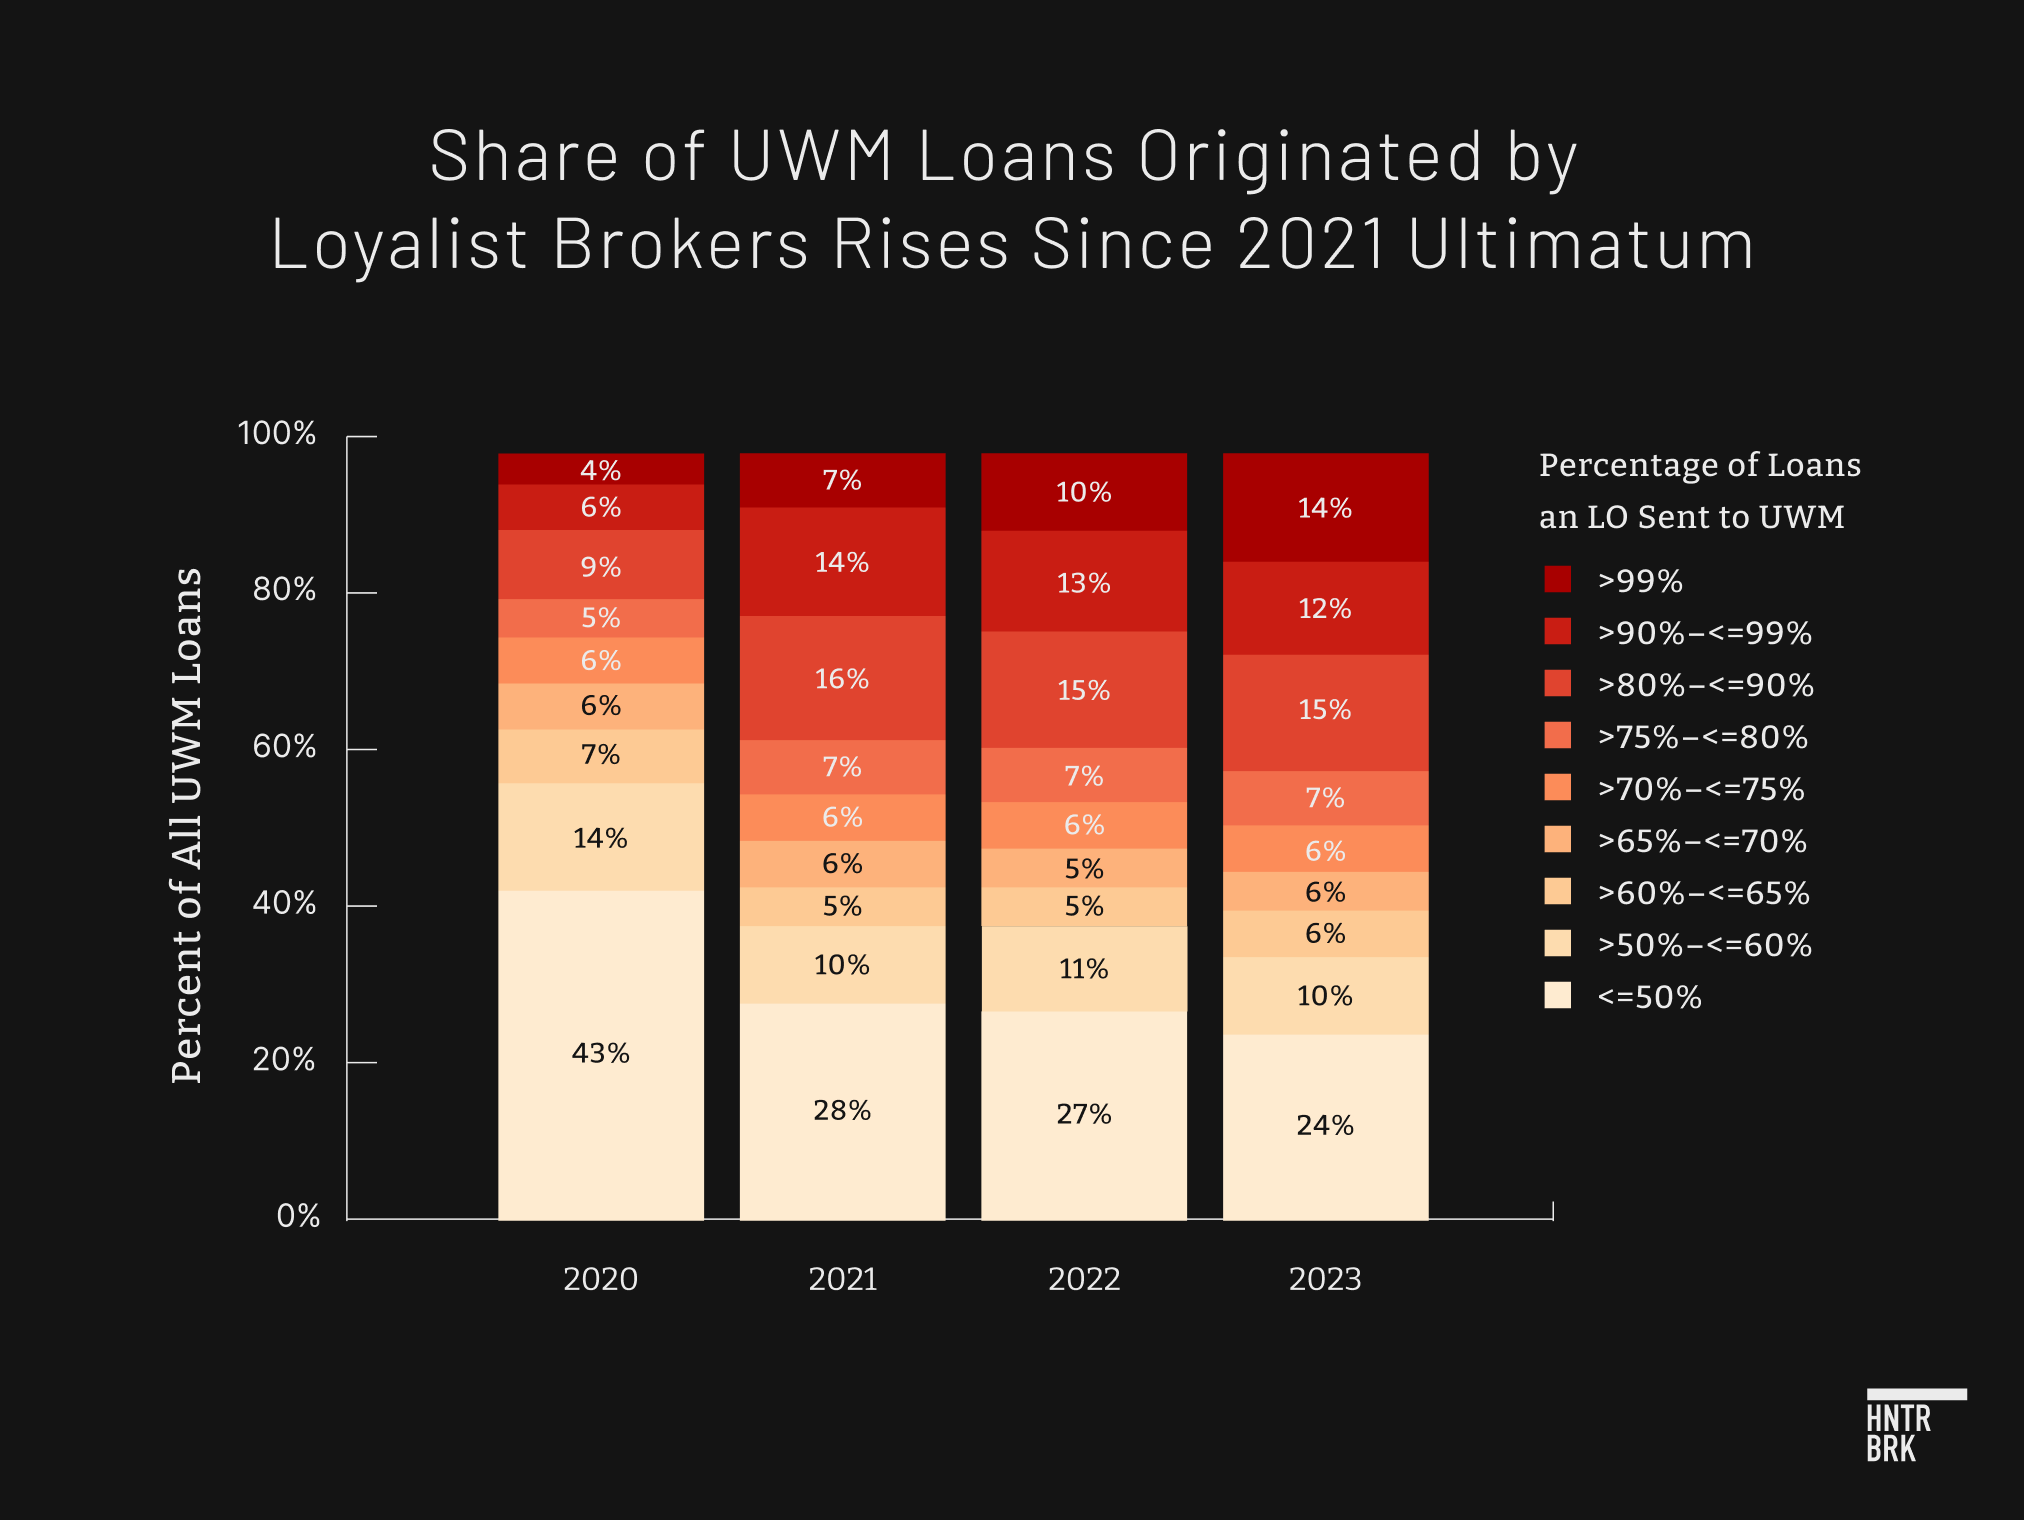
In order to answer this question, Hunterbrook included in the database a breakdown of what percentage of loans each loan officer and independent mortgage broker sent across a universe of the Deed of Trust Data.
We determined these numbers both on the basis of loan count (i.e., what percentage of loans did a given loan officer or broker send to a given lender compared to the total number of loans they gave out) and loan amount (i.e., what percentage of the money loaned through a given loan officer or broker went to a given lender compared to the total amount of dollars that actor had originated).
Across both of these dimensions, Hunterbrook found that the reality differed significantly from the branding of independent mortgage brokers. Thousands of brokers across the country send virtually all of their business to a single lender — and, in the years since the ultimatum, the concentration across the wholesale channel in general has grown significantly. UWM received a particularly large increase in the share of loan officers sending one lender a disproportionate amount of business.
2) To what extent are borrowers ending up with the “best deal”?
In order to answer this question, Hunterbrook sorted millions of loans from the top 25 wholesale lenders each year into thousands of much smaller buckets containing exclusively what we defined as “similar mortgages.” These mortgages shared the same:
- Interest rate, rounded to the nearest 0.005%
- Month of closing
- Loan term (ex.: “30-year”)
- Derived dwelling category (ex.: “single family properties”)
- Loan program (ex.: “conventional”)
- Fixed vs. adjustable rate (ex.: “fixed-rate”)
- Property type (ex.: “single family residential”)
- Loan type — including the following categories, among others: 30-year fixed conventional conforming purchase loans; 30-year fixed conventional conforming refinance loans; 30-year fixed conventional conforming cash-out refinance loans; 30-year ARM conventional conforming purchase loans; 30-year fixed conventional conforming condo purchase loans; 30-year fixed conventional conforming condo refinance loans; 30-year fixed conventional conforming condo cash-out refinance loans; 30-year fixed conventional conforming second home purchase loans; 15-year fixed purchase loans; 30-year fixed FHA purchase loans; 30-year fixed FHA refinance loans; 30-year ARM FHA purchase loans; 30-year ARM FHA condo purchase loans; and 30-year ARM FHA condo refinance loans.
Hunterbrook excluded certain categories of mortgages, which are priced differently. These include:
• Reverse mortgages
• Home equity line of credit mortgages
• Multi-use/commercial mortgages
• Second home mortgages
• Balloon payment mortgages
The idea behind all these filters was to ensure we were comparing like-with-like — eliminating variables that could otherwise have explained the difference in closing costs between one loan and another.
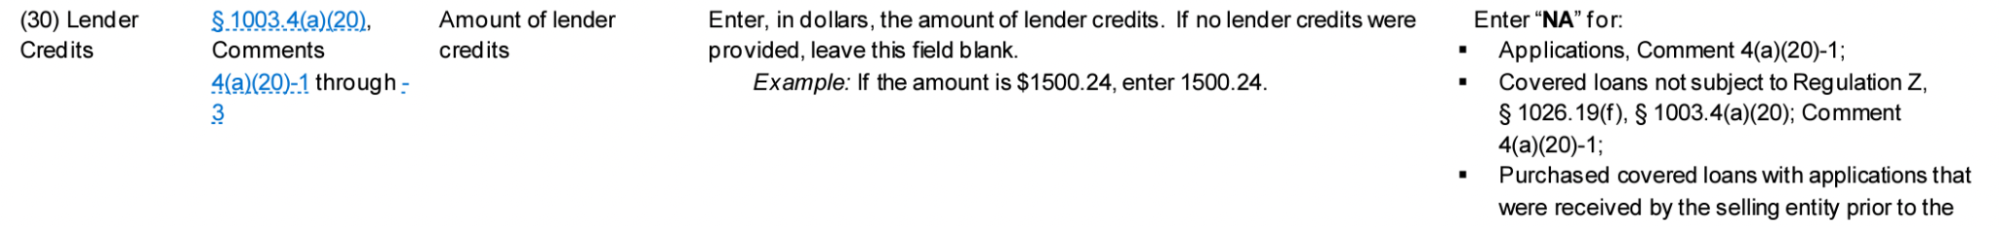
“Lender-specific closing costs” are not explicitly a listed category in either of the two datasets, but they can be approximated for each loan based on two fields that are available: origination charges and lender credits. By subtracting the latter from the former, Hunterbrook was able to estimate how much a borrower was paying to a given lender in dollar terms.
In order to account for the fact that mortgages come in many different amounts, we then normalized the cost difference as a percentage of the total loan amount.
Then, we compared these normalized cost differences between UWM and the 24 other lenders from each year in our dataset, across each of the thousands of narrowly tailored buckets.
After all of the filters were applied, Hunterbrook was able to evaluate a universe of just under 25% of UWM’s loans. Within this group, Hunterbook estimates that borrowers paid UWM $229 million more in closing costs over the past four years than those whose brokers provided them with an average priced loan. Assuming the loans evaluated by Hunterbrook are representative of the overall national population, as examined in the methodology, this indicates Americans have paid UWM an estimated $894 million more in total.
Because UWM has said its brokers will find homeowners “the best deal,” in addition to using the average, Hunterbrook also compared UWM’s loans to similar loans issued by more affordably priced lenders in any given month. This comparison aims to approximate the results if a broker were actually shopping across a universe of five options — and chose the cheapest one, controlling for all of the same variables mentioned above. Hunterbrook did this by comparing UWM’s loans to the 20th percentile loans in any given bucket.
By that metric, UWM charged Americans an estimated $912 million in extra closing costs within the universe of loans observed by Hunterbrook — and an estimated $3.5 billion in all.
Hunterbrook did not just take the underlying public record data at face value. Instead, we closely inspected the data on multiple dimensions and reviewed other publicly available sources (e.g., lender 10-K filings, market share reports, etc.) to ensure that we were controlling for as many anomalies as possible.
There are, however, many variables not included in the HMDA Data or the Deed of Trust Data — like credit scores — which meaningfully impact mortgage pricing. There are also likely confounding variables which may have pushed the results in one direction or another that we did not observe. We hope this analysis is reviewed and improved by readers, so we can continue to build on what we believe could be a powerful tool for understanding a market that impacts millions of Americans.
Background
A Quick Primer on Mortgage Pricing
Mortgage loans include costs that the borrower pays up front, at the time of closing, and costs that are paid over time, via monthly payments. The upfront costs come in the form of origination charges and the costs over time relate to the interest rate. Lenders transmit daily rate sheets to brokers, which communicate the offered rates (approximately 10-15 rates (“the rate-stack”) for each loan program, loan term, etc.) and associated mortgage pricing (points and credits) on a given day.
UWM and other nonbank lenders use warehouse facilities to fund the loans that they originate. They then monetize these originations through sales on the secondary market. They do not hold the loans as assets on their own balance sheet. As a result, the daily rate sheets are set by each lender based on the lender’s expected value of the loan set by the end purchaser or investor.
Lenders take into account loan-level price adjustments imposed by the government-sponsored enterprises that securitize the most loans (e.g., Fannie Mae Loan-Level Price Adjustments) and the government agencies that insure FHA, VA, and USDA loans. These loan-level price adjustments are generally related to the property, its intended use, and the borrower’s risk profile. These adjustments impact loans across all lenders, and there ends up being consistency across loans of similar types.
Origination charges include lender-based fees associated with the origination, underwriting, or processing of the loan and are supplemented by price adjustments: either discount points, which increase origination charges, or lender credits, which offset origination charges, based on the interest rate selected by the borrower.
If a borrower would like to maximize their cash position on the day of closing, they would opt for a higher interest rate with associated lender credits to, at least partially, offset origination charges. If a borrower would like to minimize their ongoing monthly payments, they would opt for a lower interest rate with associated discount points resulting in higher origination charges.
Sign Up
Breaking News & Investigations.
Right to Your Inbox.
No Paywalls.
No Ads.
A Quick Primer on the Data Sources Behind This Investigation
Home Mortgage Disclosure Act Data: Certain financial institutions — including large lenders such as UWM and Rocket Mortgage — are required to maintain, report, and publicly disclose loan-level information about mortgages. HMDA Data includes information about each loan, such as the rate, origination charges, lender credits, and discount points, as well as borrower and loan characteristics.
Deed of Trust Data: Hunterbrook supplemented the HMDA Data with the Deed of Trust dataset pulled from publicly available individual deeds of trust filed in connection with each mortgage closing (the “Deed of Trust Data“, and together with the HMDA Data, the “Combined Data Set“). Hunterbrook accessed this data set via a subscription to a commonly used mortgage analytics platform.
Combined Data Set: By merging the data sets, Hunterbrook was able to add specific identifying information to the HMDA data, revealing which broker and loan officer, if any, sourced the deal, as well as which lender they sent it to and the date on which the mortgage closed. The data also included information on property type, loan type, lien status, and other factors that impact pricing — which enabled Hunterbrook to control for a variety of variables.
Matching Across HMDA Data and Deed of Trust Data: The HMDA Data and Deed of Trust Data include a set of overlapping fields that allowed Hunterbrook to merge approximately 60% of HMDA Data loans with the Deed of Trust Data. The overlapping fields include the lender, loan amount, year, and census tract.
One reason we did not reach a 100% match rate is that there were many cases in which, for a given Deed of Trust entry, there were multiple loans in the HMDA data that were potential matches. In this case, in the absence of other disambiguating factors, we exclude these loans to constrain our analysis only to those for which we have high-confidence matches. As outlined below, we also believe the universe we’ve studied is similar to the universe we did not include, with one exception, which is that we appear to be missing a significant amount of non-delegated correspondent loans, due to the fact that the ultimate underwriter (in many cases, UWM) is not listed in HMDA.
Hunterbrook’s Mortgage Pricing Study provides a powerful new lens through which to analyze mortgage pricing. HMDA data is the primary source of comprehensive publicly available mortgage data and is utilized by researchers, academics, and to some extent, industry players to analyze historical loan-level mortgage transaction information. But because it does not include the loan closing date, the loan officer, or the broker company, it is inadequate for understanding the dynamics of the wholesale channel. The Deed of Trust data fills that gap.
Framework for analysis
Identifying the wholesale channel — Building our universe of lenders
Hundreds of lenders file information about their mortgages with HMDA every year. Dozens of those participate in the wholesale channel — in some cases, exclusively; in other cases, alongside their direct-to-consumer (retail) businesses.
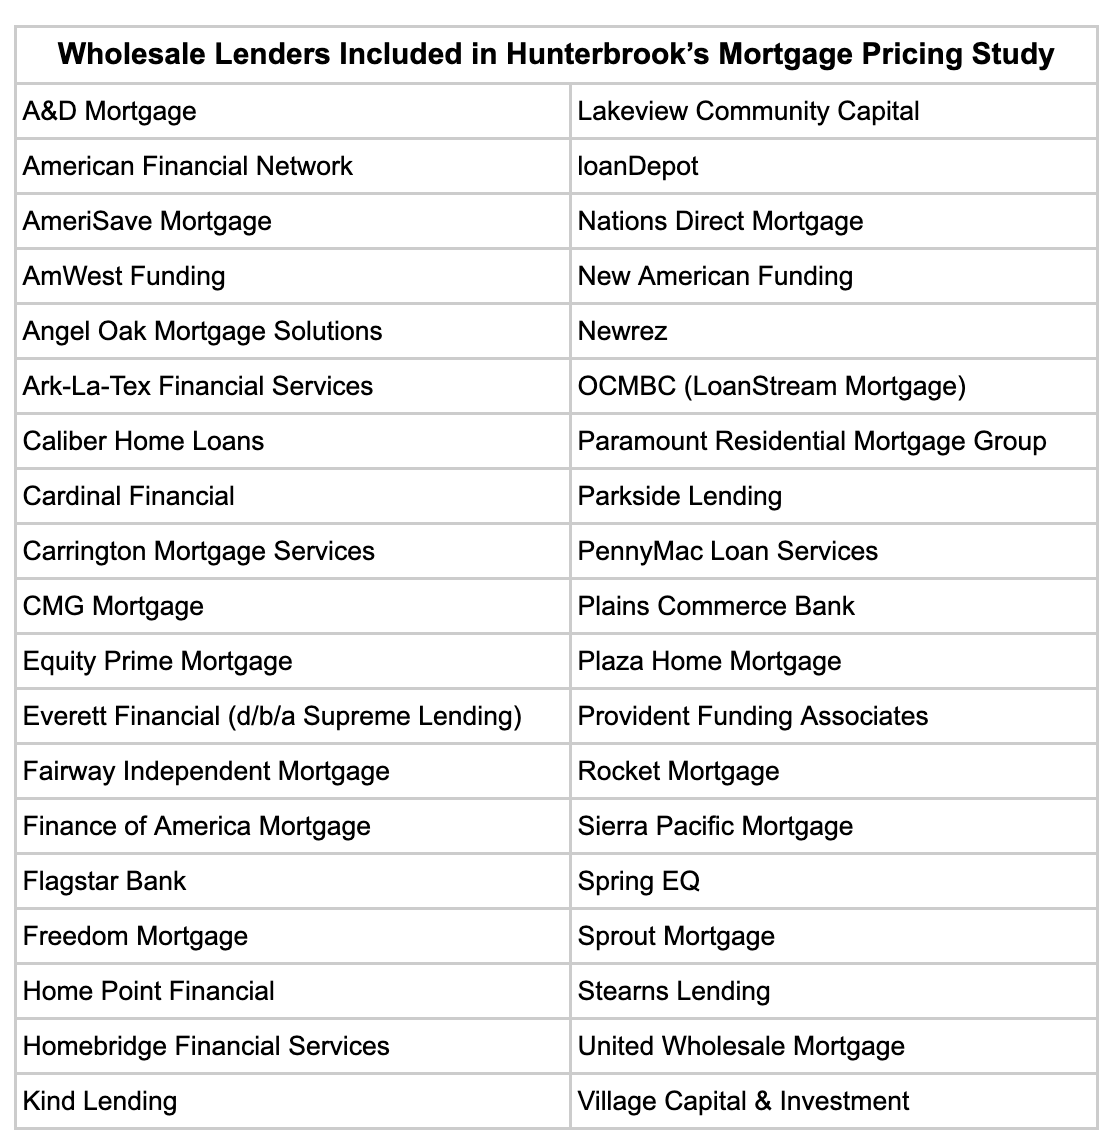
In order to identify the set of lenders available to brokers operating in the wholesale channel, Hunterbook ran queries to identify the top 25 wholesale lenders for each relevant year, 2020, 2021, 2022, and 2023. We did this after cleaning the data with extensive text normalization and manual inspection, due to the fact that there were at times numerous names for particular lenders in the dataset. We standardized around lender names used in the Global Legal Entity Identifier Foundation’s (GLEIF) lender data based on Legal Entity Identifier (LEI) and open standards. Only loans for which a normalized lender name exactly matches an LEI are considered for further analysis.
We utilized various fields within the Deed of Trust Data to separate the wholesale loans from the retail loans, including a “brokered” field and situations where the originating company did not match the lender.
Ultimately, 38 lenders in total were selected across the years and, for comparisons for each year, we narrowed that to the relevant set of top 25 wholesale lenders for that particular year.
A Note on UWM’s Non-Delegated Correspondent Loans
Both sets of data, the HMDA Data and the Deed of Trust Data, identify UWM loans.
UWM says it is “all in” on the wholesale channel, so we included the full set of UWM loans in the Mortgage Pricing Study. That said, the matching process, as described above, requires the lender field contained in the HMDA Data and Deed of Trust Data to be exactly the same.
Our review of the matched and unmatched loans showed that many of UWM’s non-delegated correspondent loans were not captured in the Combined Data Set. This relates to the way non-delegated correspondent deals are reflected in the Deed of Trust Data with the broker or originating company as the lender.
For this reason, we believe UWM’s non-delegated correspondent loans are — at least largely — missing from our dataset. Based on experience in the industry, we believe those loans tend to have higher fees. So this is one reason our estimates may be underestimating UWM’s closing costs relative to competitors.
Filtering by transaction type
Different mortgage types, from conventional loans to government-insured offerings like those provided by the Federal Housing Administration (FHA), the Veterans Affairs department (VA), or the United States Department of Agriculture (USDA), are financed differently. Each loan type carries unique eligibility requirements, interest rates, down payment stipulations, and insurance premiums, making them suitable for distinct borrower circumstances.
For example, government-backed loans may offer more lenient credit requirements and lower down payments but could also entail mandatory insurance premiums that might not be required with conventional loans. Conventional loans, meanwhile, might provide more flexibility in terms and conditions but require higher credit scores and larger down payments. The structural nuances of each loan type impact the total cost of the loan over its lifetime, as well as the immediate financial responsibilities of the borrower.
These differences also impact how the loans are ultimately priced by the secondary market. As a result, lenders price these loans differently.
By comparing loans within the same transaction type, our study ensures that the comparison is grounded in an apples-to-apples analysis, thereby eliminating the confounding variables introduced by the structural disparities between loan types. This approach allows for a more precise assessment of the variables of interest.
The following filters were applied to identify the most representative set of conventional purchase loans to compare to one another (the parenthesized values throughout this section indicate the corresponding HMDA column name and corresponding LAR data field value):
• Include only first mortgages (lien status = 1)
• Exclude reverse mortgages (reverse mortgage = 2)
• Exclude home equity line of credit (open_end_line_of_credit = 2)
• Exclude multi-use/commercial loans (business_or_commerical_purpose = 2)
• Exclude loans where monthly payments do not cover portions of principal and/or interest (negative_amortization = 2)
• Exclude other similar loans (other_nonamortizing_features = 2)
• Exclude loans where monthly payments only cover interest (interest_only_payment = 2)
• Exclude loans that require a large payment at the end of the term (balloon_payment = 2)
• Include only site-built properties (construction_method = 1)
• Include only single family residential or properties in a planned development (property.type = Single • • • Family Residential or Planned Unit Development, Residential)
• Purchaser type of Fannie Mae, Ginnie Mae, and Freddie Mac (purchaser_type in [1 ,2, 3])
Collectively, with column names matching those from HMDA data, our filters are as follows:
CONVENTIONAL CORE PURCHASE 30 YEAR FIXED
CONVENTIONAL CORE REFI 30 YEAR FIXED
CONVENTIONAL CORE CASH OUT REFI 30 YEAR FIXED
CONVENTIONAL CORE PURCHASE 30 YEAR ARM
CONVENTIONAL CONDO PURCHASE 30 YEAR FIXED
CONVENTIONAL CONDO REFI 30 YEAR FIXED
CONVENTIONAL CONDO CASH OUT REFI 30 YEAR FIXED
CONVENTIONAL SECOND HOME PURCHASE 30 YEAR FIXED
CONVENTIONAL MULTI UNIT PURCHASE 30 YEAR FIXED
CONVENTIONAL CORE PURCHASE 15 YEAR FIXED
FHA CORE PURCHASE 30 YEAR
FHA CORE REFI 30 YEAR FIXED
FHA CORE CASH OUT REFI 30 YEAR FIXED
FHA CORE PURCHASE 30 YEAR ARM
FHA CONDO PURCHASE 30 YEAR FIXED
FHA CONDO REFI 30 YEAR FIXED
FHA CONDO CASH OUT REFI 30 YEAR FIXED
FHA SECOND HOME PURCHASE 30 YEAR FIXED
FHA MULTI UNIT PURCHASE 30 YEAR FIXED
FHA CORE PURCHASE 15 YEAR FIXED
VA CORE PURCHASE 30 YEAR FIXED
VA CORE REFI 30 YEAR FIXED
VA CORE CASH OUT REFI 30 YEAR FIXED
VA CORE PURCHASE 30 YEAR ARM
VA CONDO PURCHASE 30YR FIXED
VA CONDO REFI 30 YEAR FIXED
VA CONDO CASH OUT REFI 30 YEAR FIXED
VA SECOND HOME PURCHASE 30 YEAR FIXED
VA MULTI UNIT PURCHASE 30 YEAR FIXED
VA CORE PURCHASE 15 YEAR FIXED
The above 30 segments of loans represent the vast majority of first lien closed-ended loan originations from 2020 to 2023.
An example of the configuration, corresponding to 30-year fixed conventional conforming purchase loans, and again based on HMDA columns and LAR codes, is below:
‘CONVENTIONAL_CORE_PURCHASE_30YR_FIXED’ : {
‘loan_type’ : ‘Conventional’, # Conventional
‘property_type’ : [‘Single Family Residence’, ‘Planned Unit Development’, ‘Residential’],
‘total_units’ : [‘1’],
‘occupancy_type’ : 1, # Primary Residence
‘loan_purpose’ : 1, # Purchase
‘loan_term’ :’360′,
‘intro_rate_period’ : [‘0’], #
},
These column values are used to filter individual entries before computing cost-based metrics as outlined in the sections that follow.
Time bucketing
As benchmark interest rates set by the Federal Reserve move up and down, both Treasury securities (TSY) and mortgage-backed Securities (MBS) fluctuate as well. For instance, a 5% interest rate mortgage, which would have been relatively expensive in 2020 (indicating closing costs would likely be low), would have been relatively affordable in 2023 (indicating closing costs would likely be high). For this reason, Hunterbrook incorporated time as a filtering dimension, only comparing loans that closed during the same month and year.
Comparing loans that closed on the exact same day might have removed even more variability of interest rates over time, but there were two core limitations, one practical, one theoretical:
1) Practical: Once the universe of comparable loans was narrowed down to the time frame of a day — or even a week — too high a percentage of loans in the database did not have a comparable loan to be compared against, given the dozens of other variables at play.
2) Theoretical: There is a significant lag time between when the interest rate of a mortgage is “locked” by a lender and when the loan closes. This lag time varies across loans — so even if two loans have the same closing date, as listed in the Deed of Trust data, they could have been locked in different interest rate environments (e.g., one had been closed three weeks prior; the other had been closed four weeks prior; between the two dates, the Fed announced an interest rate hike).
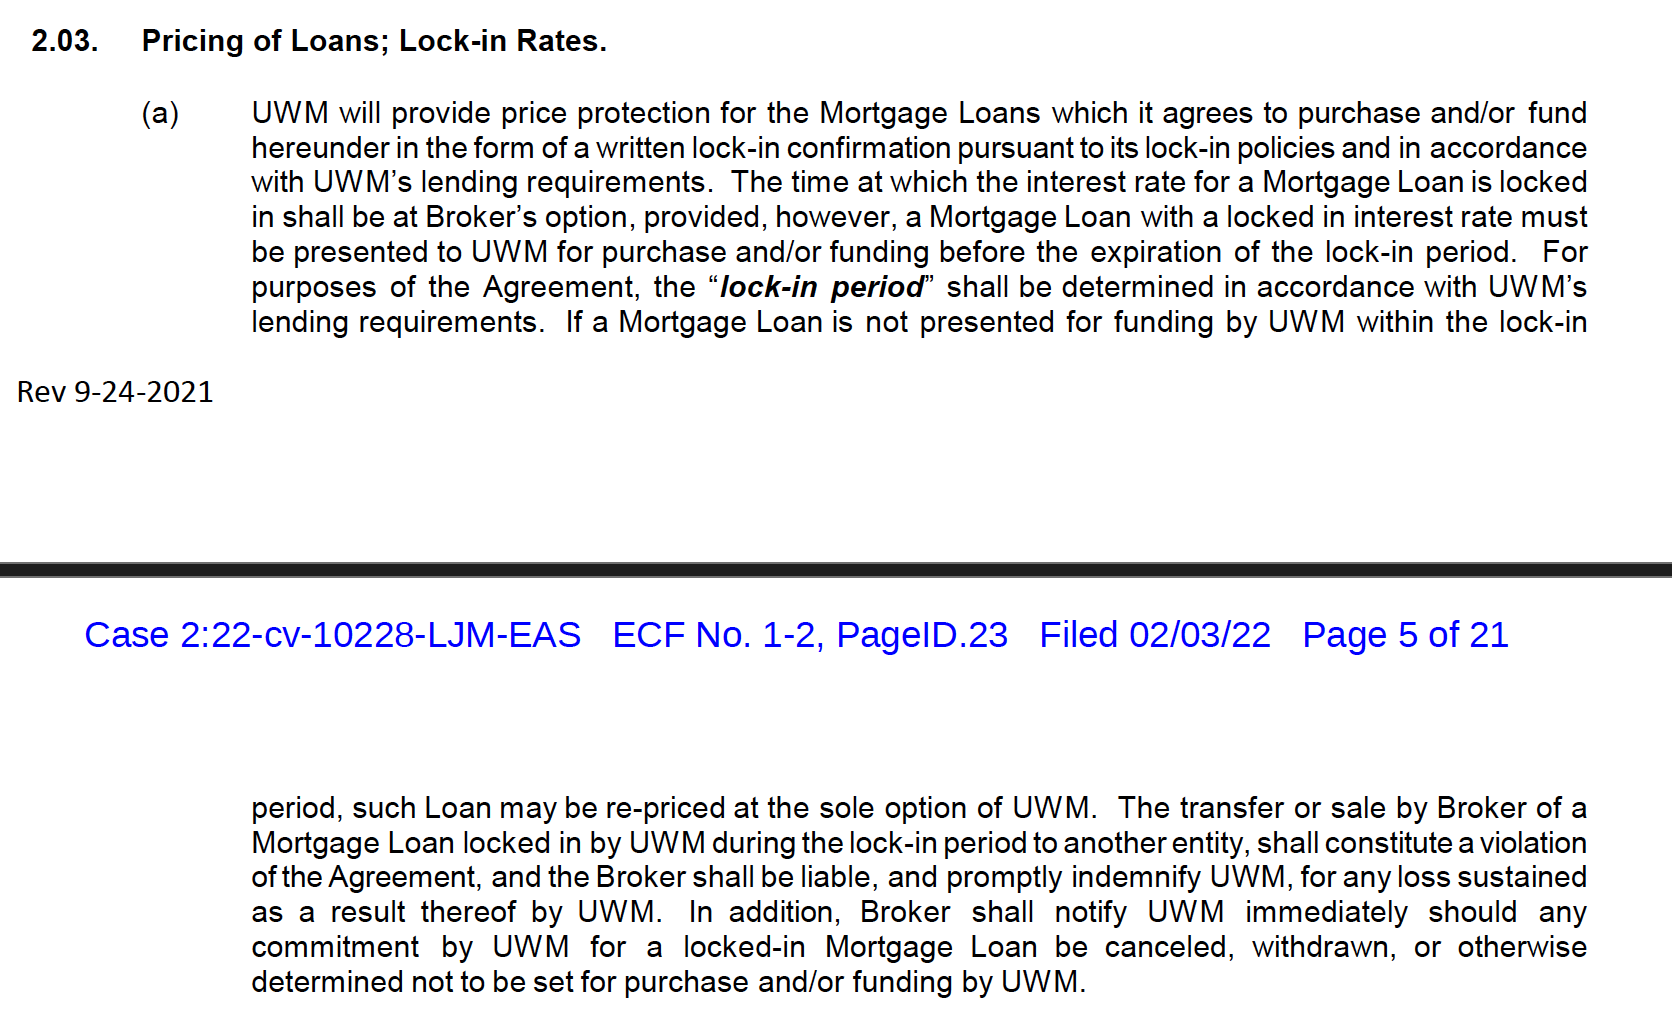
Brokers who are shopping and comparing loan programs throughout the closing process for their borrowers should be able to move them from a “locked” loan to a better deal — in the event that rates fall. UWM’s broker agreement, however, includes language that allows the company to punish brokers who direct a borrower to other lenders after the homebuyer “locks-in” their rate with UWM.
Competitor broker agreements reviewed by Hunterbrook do not include such a prohibition.
“The transfer or sale by Broker of a Mortgage Loan locked in by UWM during the lock-in period to another entity, shall constitute a violation of the Agreement, and the Broker shall be liable, and promptly indemnify UWM, for any loss sustained as a result thereof by UWM,” UWM writes in its contract.
This means that if loan pricing shifts in the homebuyer’s favor after rate lock, a time when the borrower has no contractual commitment to move forward with UWM, brokers are prohibited from fulfilling what may be, in many cases, a fiduciary duty to the borrower to bring them the best deal available.
For all of the above reasons, Hunterbrook focused on monthly groupings — which added some degree of variability surrounding the exact rate environment in which our comparable loans were closed.
Rate bucketing
Since part of the overall cost of a mortgage is embedded in the interest paid over its duration — a variable difficult to predict due to the potential for refinancing — comparisons of loans across varied rates obscure the true differences in closing cost. So we set out to group loans into rate buckets.
To achieve this control — and because lenders will often customize the interest rates they offer by a marginal thousandth of a percent — we rounded interest rates to the nearest 0.005%. This level of granularity, recommended by industry experts, balances precision with practicality, allowing for the grouping of loans with nearly identical rates.
This approach is supported by the insight, also gleaned from industry experts, that minor rate variations — those below 0.005% — tend not to significantly affect loan costs or fees from the borrower’s perspective (e.g., lenders don’t generally offer borrowers higher or lower closing costs based on them accepting a loan with an interest rate less than 0.005% higher or lower than another).
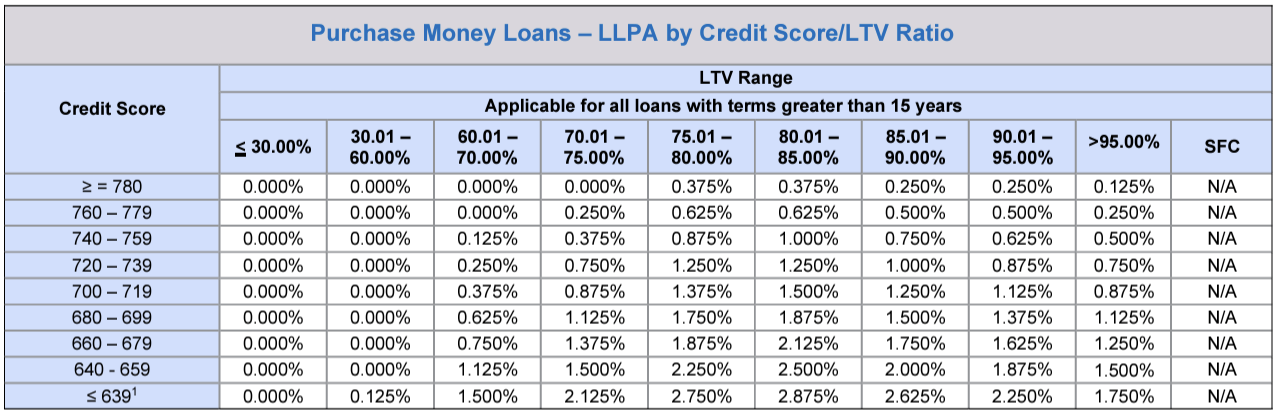
In the absence of credit score in HMDA Data, we sought ways to control for differences in the financial realities of borrowers. After all, many of the small differences in loan pricing relate to the loan-level adjustments set by the GSEs, based in part on credit score, but also on LTV, which measures the relationship between loan amount and the value of the subject property. As shown below, Fannie Mae’s pricing matrix includes a table that crosses credit score and LTV to determine one of the loan-level price adjustments. We used the LTV bins provided in this matrix (<=30%, 30-<=60%, 60-<=70%, 70-<=75%, 75-<=80%, 80-<=85%, 85-<=90%, 90-<=95%, >95%) to further refine the comparability among loans within a comparison bucket.
A Note on Bucket Size:
With all of these filters in place, certain loans end up in an otherwise empty rate bucket without any comparable loans. At other times, a loan finds a home in a bucket populated only by a couple of other loans. Because we wanted to be able to conduct robust comparisons, evaluating any loan against at least several other similar loans, we evaluated only mortgages in a bucket with at least five total loans, from at least two different lenders (i.e., UWM and at least one additional lender).
Sign Up
Breaking News & Investigations.
Right to Your Inbox.
No Paywalls.
No Ads.
How to Compare Lender-Specific Closing Costs
Key Mortgage Pricing Metric #1: Origination Charges
Origination charges offer a transparent metric for evaluating the financial burden imposed on borrowers by lenders — and comprise fees directly associated with the processing and funding of a loan, such as application fees, underwriting fees, and points charged. These charges, as reported in HMDA Data, serve as a tangible representation of lender pricing strategies and their competitiveness within the market.
Certain other studies compare Total Loan Costs between lenders, rather than Origination Charges. Total Loan Cost encompasses a wide array of expenses, including property-specific fees such as property taxes, escrows, and title fees. While these costs matter to borrowers, they vary based on geographical location, closing date, and property type — given the nature of these inputs we believe they make the total loan costs calculation less representative of lender-specific costs due to increased variance from transaction to transaction relative to origination charges.
The benefit of using origination charges is that these charges isolate fees paid by borrowers directly related to the lender and broker. The main disadvantage is that, in some cases, lenders are responsible for the third-party fees captured by Total Loan Cost — for instance, a lender might own an appraisal management company.
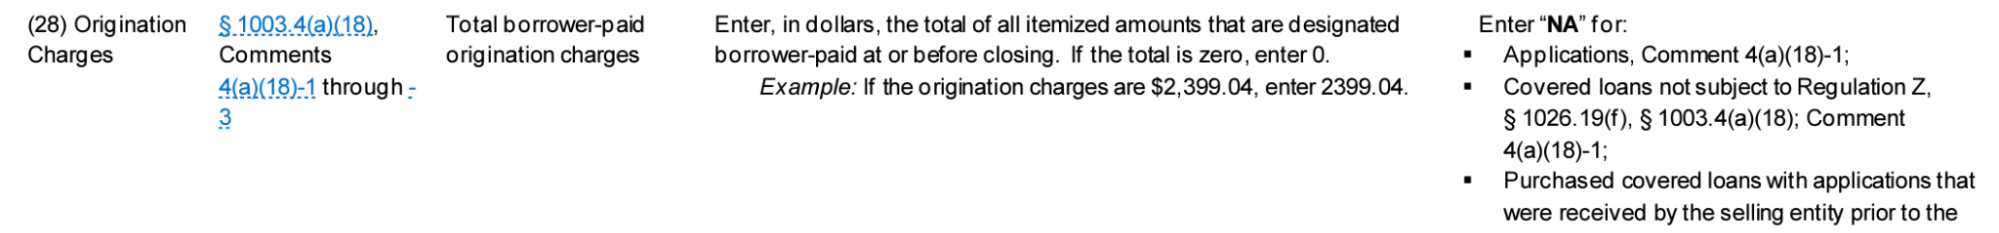
The Origination Charges field in HMDA is closely linked to the Origination Charges item required by the RESPA-TILA Integrated Disclosures (TRID). The text of 12 CFR 1026.37(f)(1) spells out the exact requirements of the Origination Charges line of the Closing Disclosure.
Origination charges. Under the subheading “Origination Charges,” an itemization of each amount, and a subtotal of all such amounts, that the consumer will pay to each creditor and loan originator for originating and extending the credit.
Pursuant to 12 CFR 1026.37(f)(1), lenders must disclose Originations Charges in the top red box below:
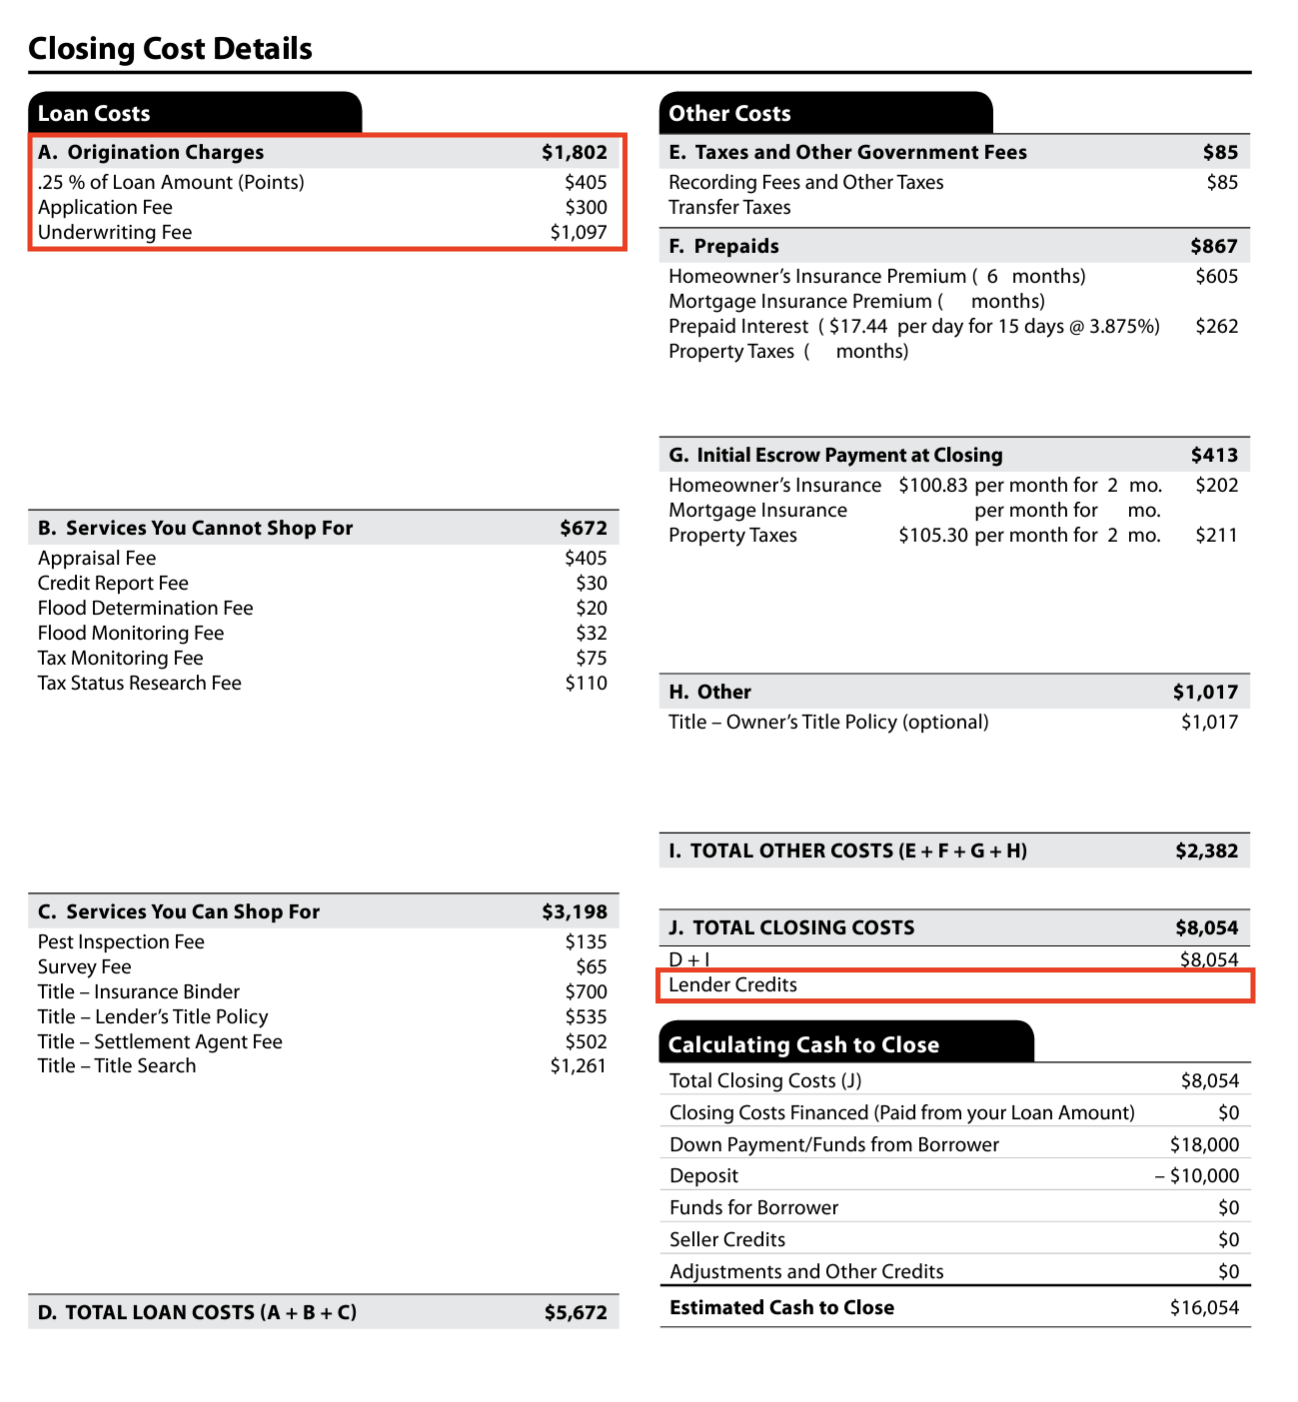
The Federal Financial Institutions Examination Council (FFIEC) publishes instructions for HMDA filers, and the requirements for the Origination Charges field largely tracks TRID.
Key Mortgage Pricing Metric #2: Lender Credits
Origination charges alone don’t always incorporate offsetting benefits lenders can provide borrowers. These are called lender credits.
Lender credits are specific financial concessions provided by lenders to borrowers at the closing of a mortgage transaction. These credits are typically applied towards the borrower’s closing costs, effectively reducing the amount of cash a borrower needs to pay up front. Lender credits can be offered for various reasons, including as an incentive for borrowers to accept a higher interest rate on their loan.
Essentially, lender credits serve as a mechanism through which lenders can offer financial relief to borrowers, while potentially adjusting other loan terms to maintain profitability.
In order to account for this variable, Hunterbrook subtracted the lender credits received by a given borrower from their origination costs to arrive at what we called the “blended origination charge.”
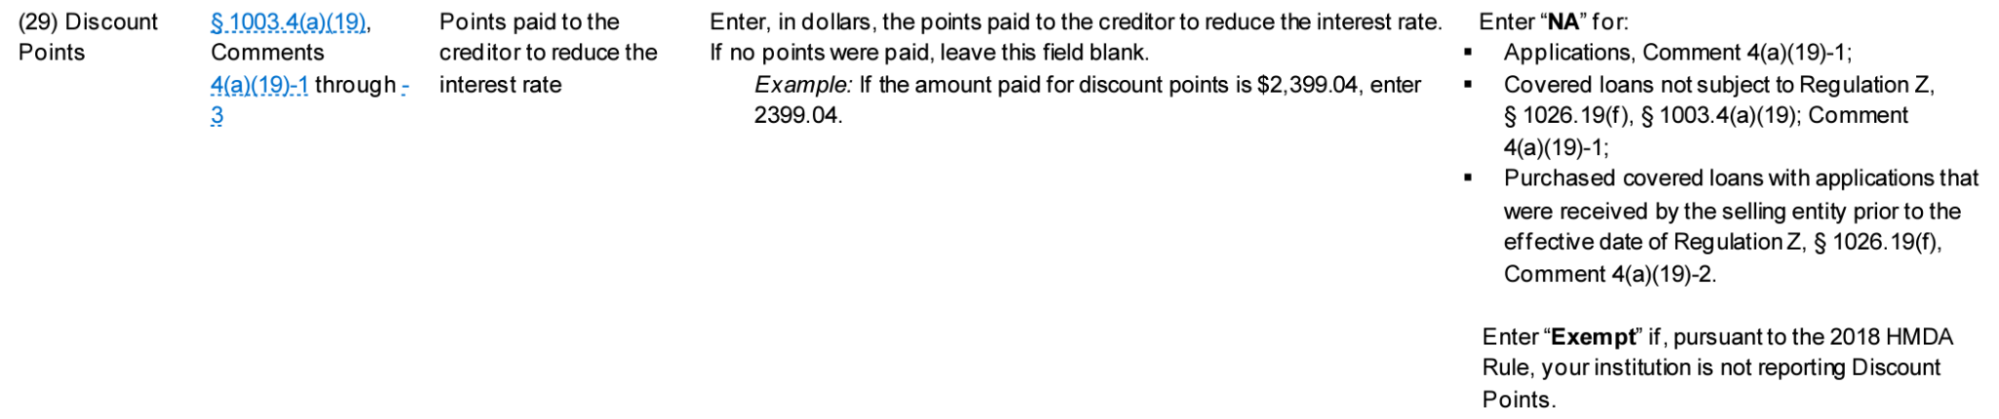
Key Mortgage Pricing Metric #3: Discount Points
Discount points represent the flip side of lender credits in the cost spectrum of mortgage transactions. They are upfront fees paid by borrowers to reduce the interest rate on their loans, effectively decreasing the monthly payments and the total amount of interest paid over the life of the loan. These points are a form of prepaid interest, with a point equaling 1% of the loan amount. Points (and lender credits) are determined by a lender for each interest rate being offered on a given day and can vary from 0-3% for qualified mortgages.
Paying discount points is a strategic choice for borrowers planning to stay in their homes for a long time, as the upfront cost can lead to significant interest savings down the line. But unlike lender credits, in HMDA, discount points are generally included within the reported origination charges.
This inclusion means that our blended origination charge, which adjusts origination charges by subtracting lender credits, inherently accounts for the cost implications of discount points without the need to treat them as a separate category.
Hunterbrook’s metric for lender-specific origination charges: Normalized Blended Origination Charge (NBOC)
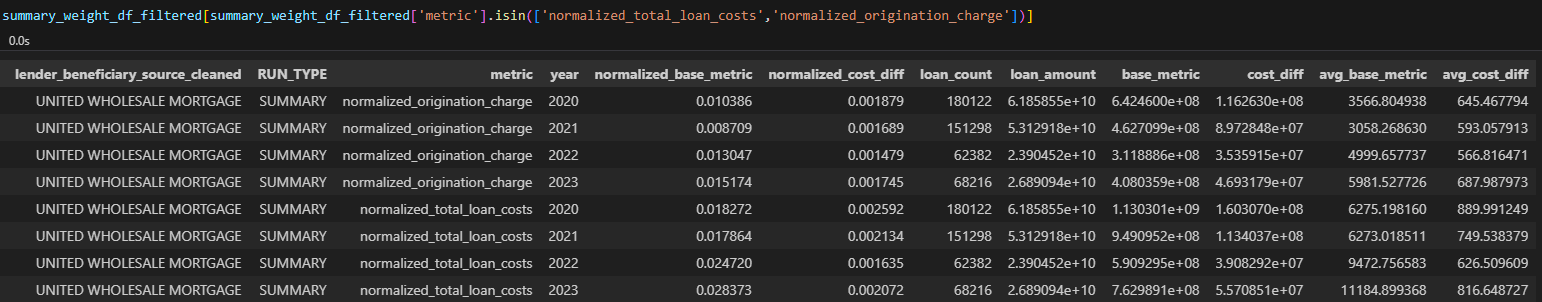
After we have created the blended price, we then normalize it on the basis of the total loan amount.

This method is necessary because certain lenders calculate points, fees, and origination charges as a percentage of the loan amount. It also enables us to include loans of varying sizes in the same buckets.
Hunterbrook’s metric for the delta in lender-specific origination charges: Normalized Cost Difference
Once we have narrowed down our universe from millions of loans to buckets with as few as five loans — and calculated the NBOC for each of these loans — we use multiple approaches to evaluate the average NBOC across both lenders and rate buckets.
We then calculate the cost difference between each loan record within the bucket and the various comparison values calculated in the previous step. This includes calculating the cost difference between the average NBOC of UWM’s loans in a given rate bucket and the average of each lender’s average NBOC (inclusive and exclusive of UWM), as well as the median NBOC of the lender NBOC averages. We evaluated similar calculations using averages across the full rate bucket as well.
Finally, we average the various cost differences together, in order to limit the impact of any delta between different statistical aggregations that we leveraged (mean of means vs. mean of means, mean of means vs. loan level means, and mean of means vs. median of means).
End-to-end, this process is as follows, starting with loan level data containing NBOC, a particular lender, an interest rate, month, year, and loan-to-value ratio (LTV):
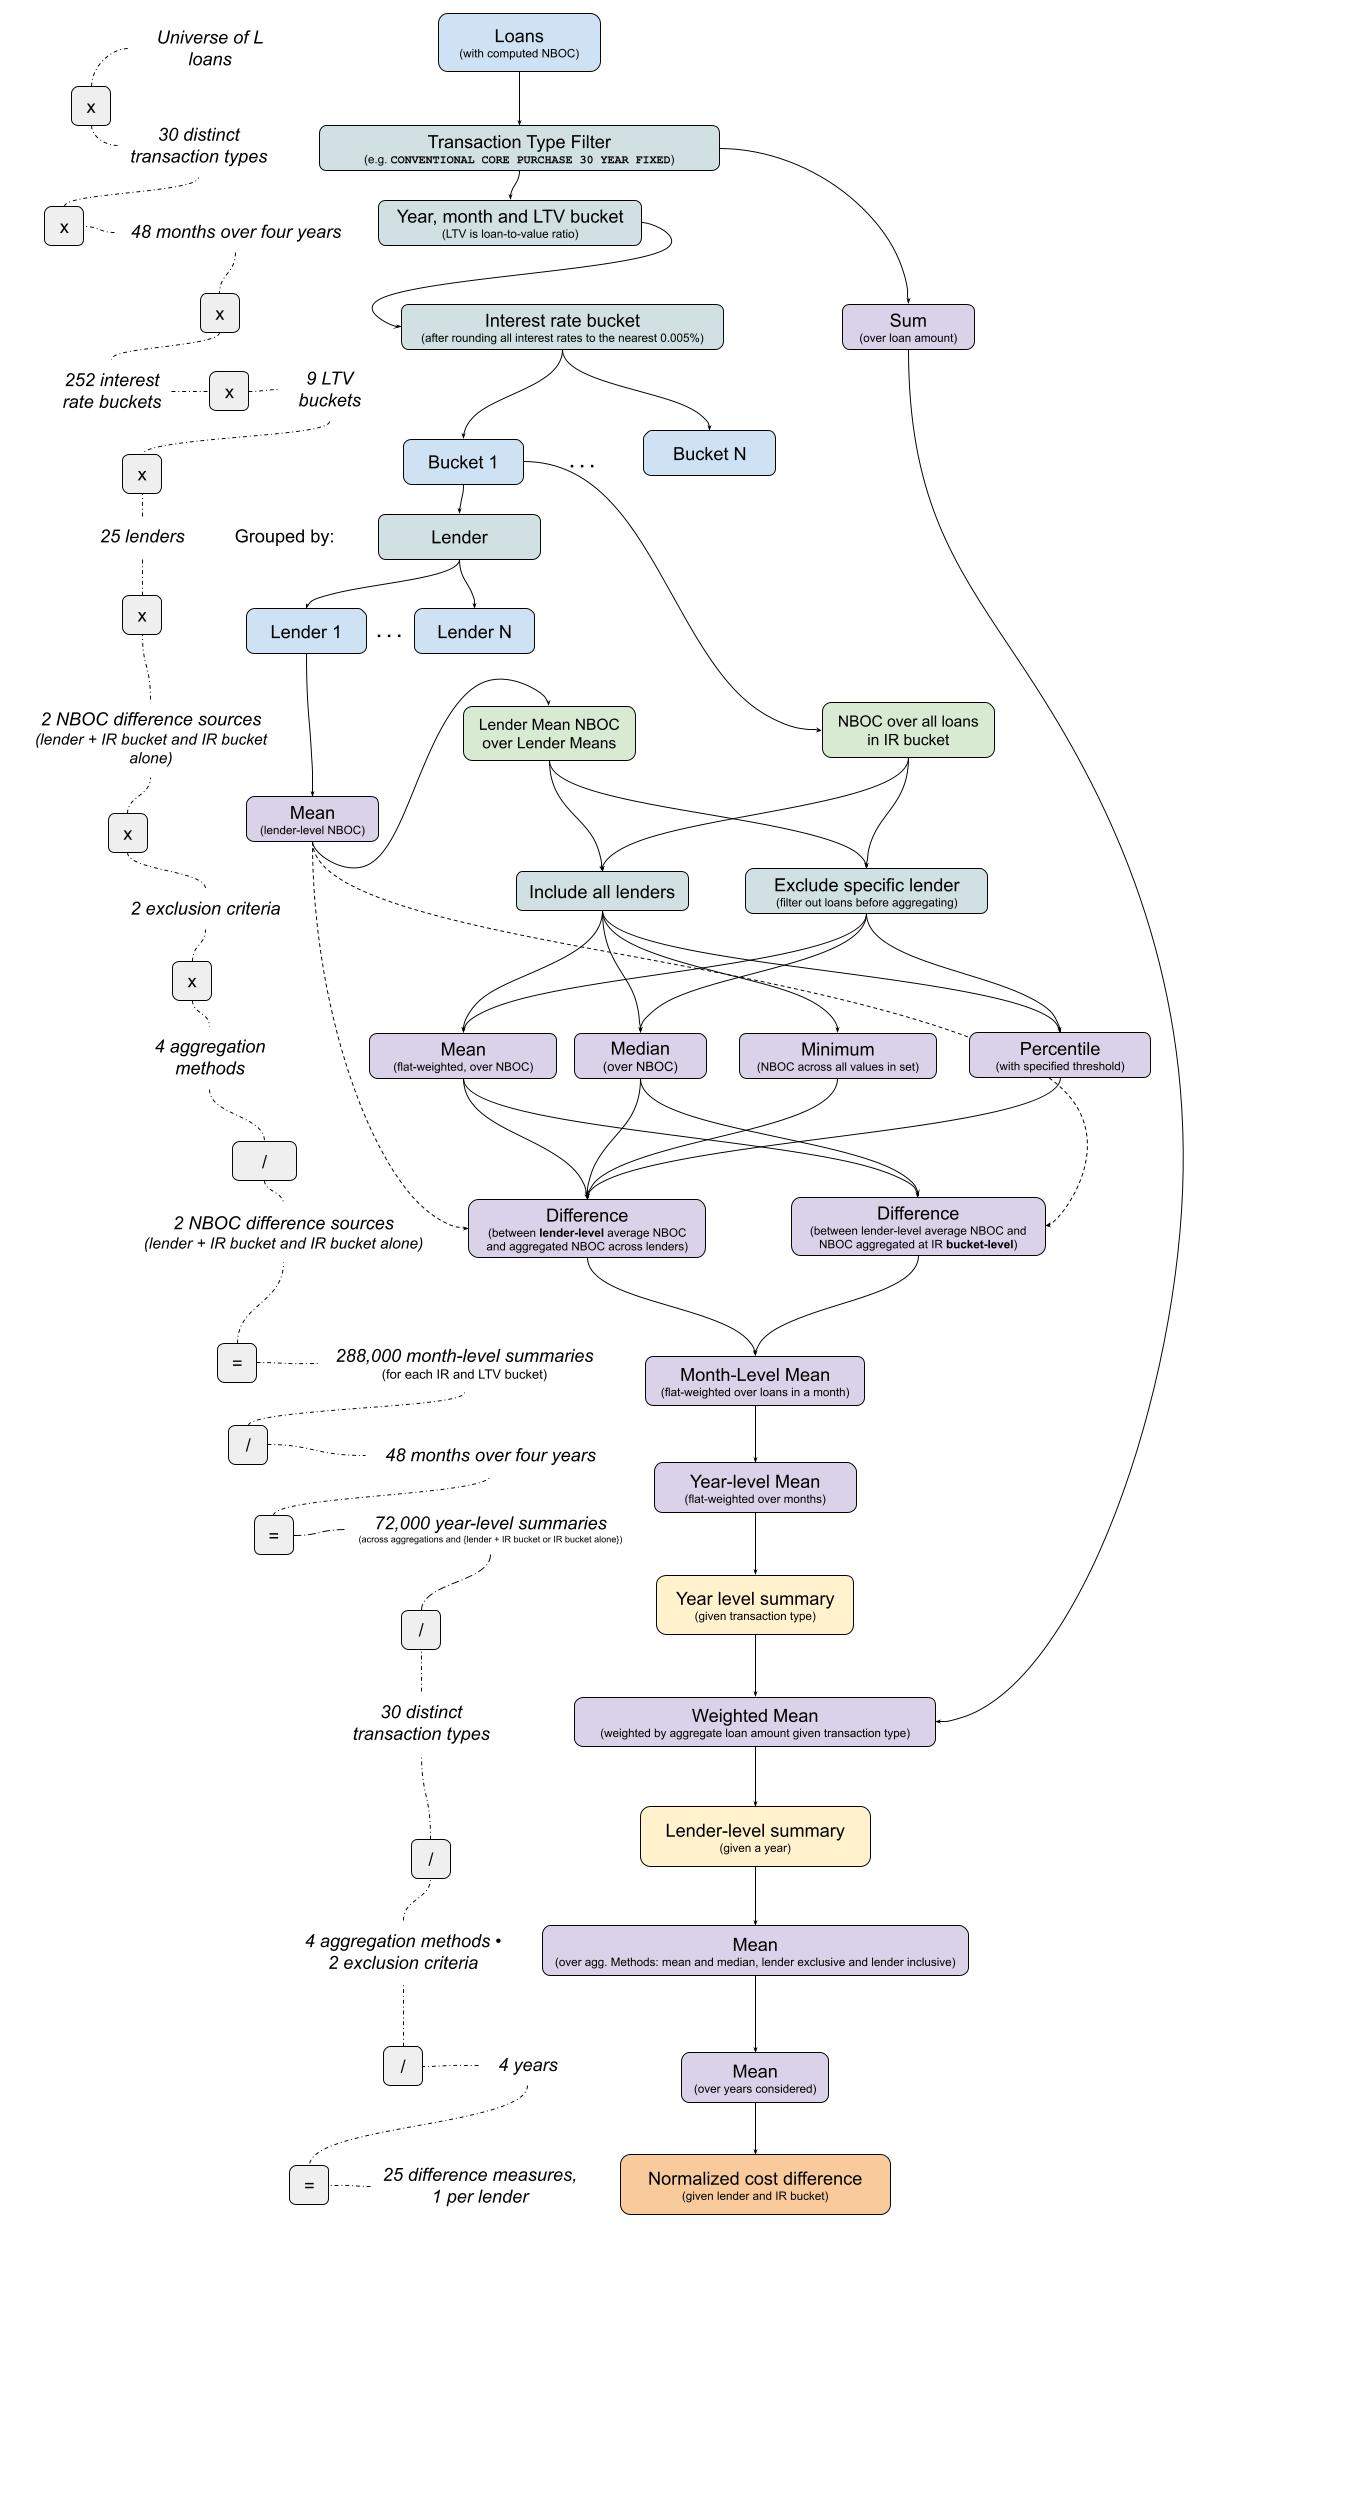
We call the resulting number the “normalized cost difference” within the bucket.
Aggregating across rate buckets and runs
Once we’ve calculated normalized cost differences for each rate bucket individually, we aggregate across the rate buckets by averaging the values.
Because certain rate runs are significantly higher populated than others, we did this aggregation with an average weighted to the total loan amount in each run.
Expressing Cost Differences in Dollar Terms
The normalization steps described above — which transformed charges expressed in dollars into percentage terms — allow us to turn our cost differences back into dollars after we’ve aggregated, simply by multiplying the NBOC against the aggregate loan amount.
Scaling based on data coverage
We further employed a conservative deduplication process to further avoid overrepresentation. In cases where multiple HMDA records were candidates to correspond to a particular Deed of Trust entry, we considered none of the loans in question for aggregated analysis given that we could not reliably ascertain pricing data for that Deed of Trust entry. Additionally, certain matched loans would not enter our comparative framework due to not having enough loans to compare against.
The universe of loans evaluated by Hunterbrook ended up being about 25% of the UWM loans in the HMDA database based on count across 2020 through 2024.
Recognizing that our data may be representative of UWM’s overall loan population, but also may be different in various unobservable ways, we provide both (1) the data estimated based on the specific loans that entered the comparative framework and (2) a scaled-up estimate that extrapolates on our base findings by taking a multiple derived from the reciprocal of number of matched loans versus the HMDA number of loans (i.e., 1 / 25% = 4.0).
Validation: Controlling for Closing Costs, Ensuring Interest Rates are Consistent
In addition to controlling for interest rates to evaluate closing costs, Hunterbrook also wanted to control for closing costs to evaluate interest rates. The goal was to verify that the reason for UWM’s inflated closing costs wasn’t that they were offering disproportionately low interest rates.
Building on our existing framework, the rounding procedure employed to form interest rate buckets was utilized on NBOC to create rounded NBOC bucket rounding to the nearest 0.0001. After bucketing and filtering for the same parameters utilized to compare NBOC, differences between individual loan interest rates were compared at the mean and median levels (both including and excluding loans from the lender being compared), or four measures. Means of comparable loans against these measures were then formed on a monthly and then annual level. Summaries of each measure across all categories of comparable loans were then loan weighted on an annual basis. Finally, a mean of all of the measures was drawn to form our interest rate comparison metric.
Based on this comparison metric, UWM appeared to offer rates 4 basis points below comparable loans in 2020. In 2021 and 2022, this reversed and the company appeared to offer rates 3 basis points above comparable loans 2021 and 2022. In 2023, UWM appears to have offered relatively more in-line rates, based on offering rates that in aggregate were 1 basis point above our comparison metric.
Limitations of the Mortgage Pricing Study
Credit score, a key input to loan pricing, is not present in HMDA
Borrower FICO scores are not included in HMDA data for privacy reasons — but they have a significant impact on mortgage loan pricing. While we aimed to account for some of these differences — by factoring in LTV, transaction type, and other filters — some of the deltas within rate buckets might have ended up being larger or smaller if credit scores had been included.
That said, large lenders such as UWM that service a large proportion of the market originate loans across a huge swath of the distribution of borrower credit scores. Likewise, the wholesale control group is likely to represent a relatively normal distribution across borrower credit scores.
UWM does not appear to originate loans from a disproportionate amount of low credit score borrowers compared to other wholesale lenders.
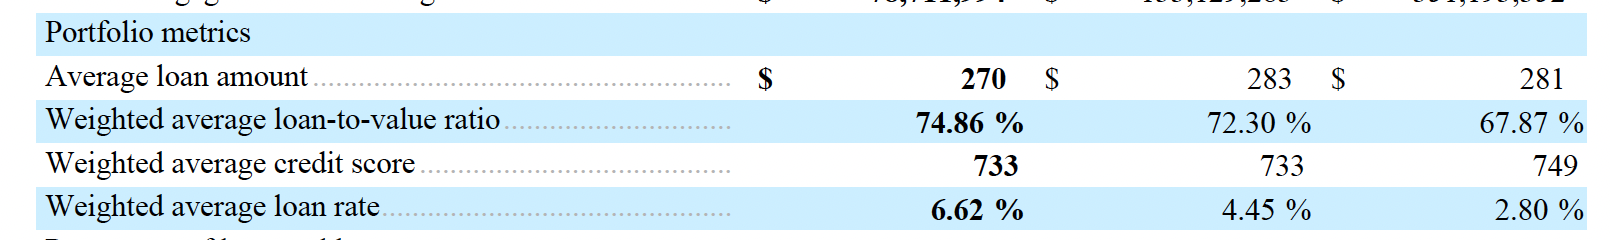
As UWM reported in its 2023 10-K: “For the year ended December 31, 2023, our originated loans had a weighted average loan to value ratio of 82.89%, and a weighted average FICO score of 737. For the year ended December 31, 2022, our originated loans had a weighted average loan to value ratio of 79.67%, and a weighted average FICO score of 738.”
In its 2022 10-K, UWM included: “For the year ended December 31, 2021, our originated loans had a weighted average loan to value ratio of 71.68%, and a weighted average FICO score of 750.”
UWM:

Rocket:
There may be lender specific HMDA reporting differences
HMDA has guidelines on how lenders are supposed to report their loans — but there are variations in how different lenders report their data. One example is in regard to lender credits. It appears that some lenders, including Rocket, report very few lender credits. In Rocket’s case, based on Hunterbrook’s review of available Rocket closing disclosures, they deduct what would otherwise be a lender credit from Origination Charges and if Origination Charges are exhausted they deduct from Total Loan Cost.
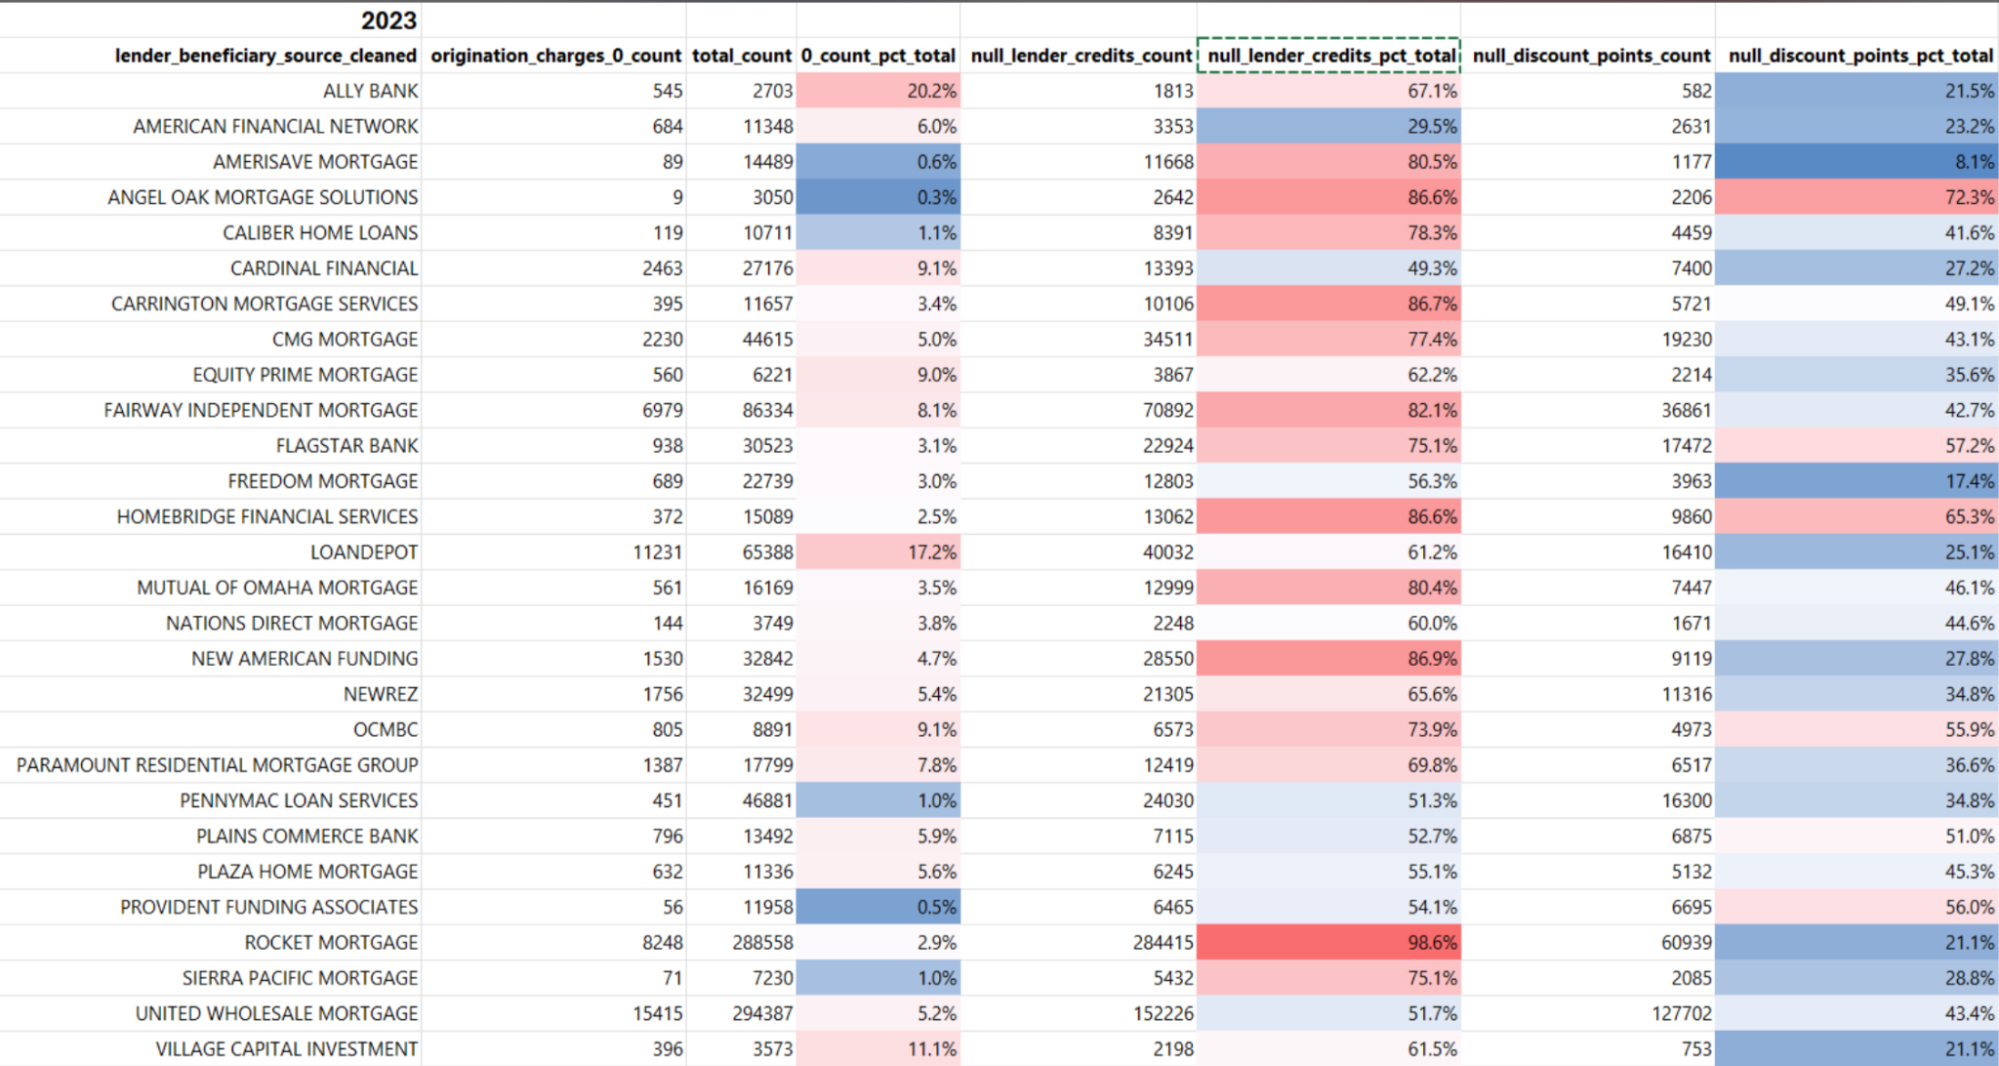
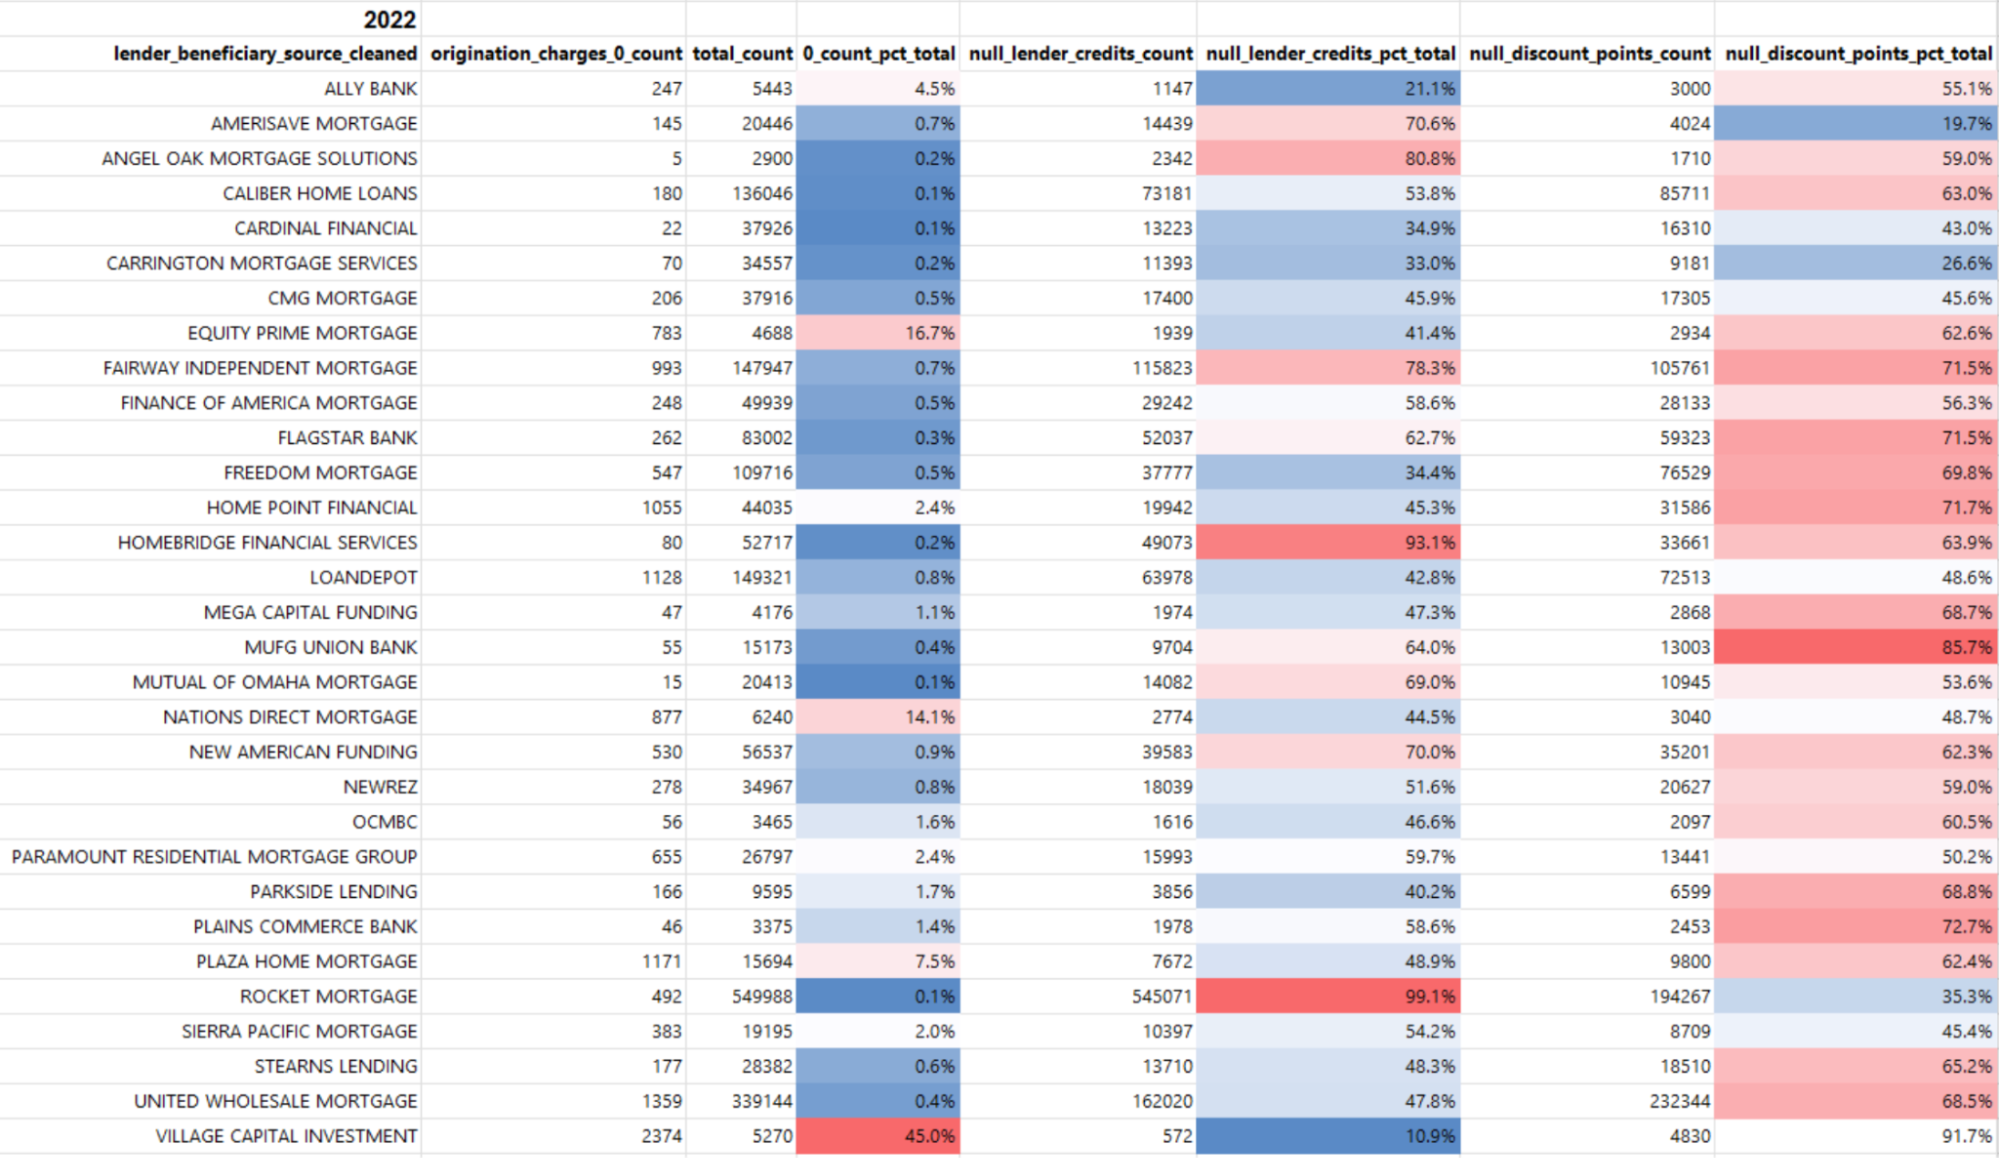
We hope that, by combining origination charges with lender credits, we account for this specific discrepancy in many cases. But there may be other, unobserved differences in how lenders report their loans that impacted the results of this data analysis. That is, of course, true of the wide body of academic research that has been conducted on the basis of HMDA.
In general, we developed an approach to standardizing empty or not-applicable values and in many cases filter out loans for which entries are ambiguous.
Differences in convexity impacting normalization
A key step in our process for comparing closing costs is normalizing on the basis of loan size. This is, generally, believed to be an effective approach, since lenders, themselves, calculate closing costs as a percent of loan size. An important caveat, however, is that for loans below $250,000, there can be meaningful differences in the convexity of loan pricing causing secondary premiums to increase and origination charges to be higher.
This is not entirely accounted for by our method.
By focusing our analysis on the 25 highest-volume national lenders in each year, however, we hoped to increase the uniformity of the distribution of loan amounts across lenders.
We also believe, based on evidence that UWM’s borrowers have relatively high credit scores compared to competitors, this potential confounding variable is likely making UWM look relatively more affordable in our analysis than they otherwise would be.
Data deficiencies when identifying wholesale loans
Our baseline approach for identifying wholesale/brokered loans simply requires that a Broker NMLS ID field be filled. However, in many instances we found that while the Broker NMLS ID field was not filled, the underlying loan was in fact brokered. Mislabeled brokered loans were identified by detecting a conflict between the indicated Lender Beneficiary and the provided Loan Company NMLS ID. For example, Rocket Mortgage Loan Company NMLS ID is 3030, and while the company was indicated as Lender Beneficiary, a different Loan Company NMLS ID was provided. For Rocket, Hunterbrook validated that loans with a conflict between Lender Beneficiary and Loan Company NMLS ID were originated by brokers by looking up the in-conflict Loan Company NMLS IDs as well as the associated Loan Officer NMLS IDs. These loans were then reclassified as being brokered.
Similarly, for wholesale-only lenders Home Point Financial and United Wholesale Mortgage, all loans were treated as being brokered.
The true impact of UWM’s ultimatum may be endogenous to the control group as well
In recent years, competitors have left the industry, including Fairway Independent Mortgage Corporation, Stearns Lending, and others. This has led to increased concentration across the board, not just among the brokers who send UWM a disproportionate share of business.
One result of this increased concentration is that prices may have increased across the sector.
Closing costs have increased across the entire universe of lenders factored into our study. Within our matched database, total loan costs as a percentage of loan amount have increased from 1.783% in 2021 to 2.834% in 2023. Origination charges as a percentage of loan amount increased from 0.871% in 2021 to 1.517% in 2023.
For this reason, the true impact of UWM’s tactics on consumers — and the resulting decrease in competition — may be more significant than this study indicates.
Studies That Influenced Hunterbrook’s Approach
Hunterbrook reviewed industry and academic studies on mortgage pricing and cost analysis and incorporated some of these strategies into our approach.
Consumer Financial Protection Bureau. (2023, May 24). “Mortgage data shows that borrowers could save $100 a month (or more) by choosing cheaper lenders.” CFPB. (link)
Maloney, C. (2023, December 18). “Borrowers Turned to Nonbank Lenders for Mortgages — And It’s Costing Them.” Bloomberg News. (link)
Bhutta, N., Fuster, A., & Hizmo, A. (2020). “Paying Too Much? Price Dispersion in the US Mortgage Market.” Federal Reserve Board. (link)
The Study That Didn’t
UWM has a favorite number: $9,400. It’s listed on the company’s broker directory; mentioned in Ishbia speeches; cited in its investor presentations. “Independent mortgage brokers are saving borrowers $9,400 compared to retail lenders,” Ishbia boasted in a LinkedIn post.
In smaller font, a UWM footnote clarifies that this isn’t always true. The number is from a study conducted by a UWM-funded industry group, the Association of Independent Mortgage Experts (AIME).
That year, this group of loans represented just a narrow band of the total originations and excluded all government loans, including FHA loans typically for lower-income borrowers.
Still, Mortgage Matchup, which only includes UWM affiliated brokers, cites that number from the AIME study: $9,407. And as recently as February 28, Ishbia claimed on an earnings call with shareholders and bank analysts that “mortgagematchup.com … saves consumers thousands and thousands of dollars.”
Hunterbrook asked UWM to share the AIME study as part of its request for comment. UWM responded with a cease and desist.
***
Hunterbrook Media publishes investigative and global reporting — with no ads or paywalls. When articles do not include Material Non-Public Information (MNPI), or “insider info,” they may be provided to our affiliate Hunterbrook Capital, an investment firm which may take financial positions based on our reporting. Subscribe here. Learn more here.
Please contact ideas@hntrbrk.com to share ideas, talent@hntrbrk.com for work opportunities, and press@hntrbrk.com for media inquiries.
LEGAL DISCLAIMER
© 2024 by Hunterbrook Media LLC. When using this website, you acknowledge and accept that such usage is solely at your own discretion and risk. Hunterbrook Media LLC, along with any associated entities, shall not be held responsible for any direct or indirect damages resulting from the use of information provided in any Hunterbrook publications. It is crucial for you to conduct your own research and seek advice from qualified financial, legal, and tax professionals before making any investment decisions based on information obtained from Hunterbrook Media LLC. The content provided by Hunterbrook Media LLC does not constitute an offer to sell, nor a solicitation of an offer to purchase any securities. Furthermore, no securities shall be offered or sold in any jurisdiction where such activities would be contrary to the local securities laws.
Hunterbrook Media LLC is not a registered investment advisor in the United States or any other jurisdiction. We strive to ensure the accuracy and reliability of the information provided, drawing on sources believed to be trustworthy. Nevertheless, this information is provided "as is" without any guarantee of accuracy, timeliness, completeness, or usefulness for any particular purpose. Hunterbrook Media LLC does not guarantee the results obtained from the use of this information. All information presented are opinions based on our analyses and are subject to change without notice, and there is no commitment from Hunterbrook Media LLC to revise or update any information or opinions contained in any report or publication contained on this website. The above content, including all information and opinions presented, is intended solely for educational and information purposes only. Hunterbrook Media LLC authorizes the redistribution of these materials, in whole or in part, provided that such redistribution is for non-commercial, informational purposes only. Redistribution must include this notice and must not alter the materials. Any commercial use, alteration, or other forms of misuse of these materials are strictly prohibited without the express written approval of Hunterbrook Media LLC. Unauthorized use, alteration, or misuse of these materials may result in legal action to enforce our rights, including but not limited to seeking injunctive relief, damages, and any other remedies available under the law.